HOT TOPICS LIST
- MACD
- Fibonacci
- RSI
- Gann
- ADXR
- Stochastics
- Volume
- Triangles
- Futures
- Cycles
- Volatility
- ZIGZAG
- MESA
- Retracement
- Aroon
INDICATORS LIST
LIST OF TOPICS
PRINT THIS ARTICLE
by David Penn
A 2B test of bottom in the daily chart is confirmed by a 2B test of bottom in the weekly chart.
Position: N/A
David Penn
Technical Writer for Technical Analysis of STOCKS & COMMODITIES magazine, Working-Money.com, and Traders.com Advantage.
PRINT THIS ARTICLE
SUPPORT & RESISTANCE
2B Daily And Weekly
11/02/05 09:51:23 AMby David Penn
A 2B test of bottom in the daily chart is confirmed by a 2B test of bottom in the weekly chart.
Position: N/A
| Every now and then, it is a good idea for those of us who rely on sets of indicators to strip a chart to its bare essentials. By "bare essentials," I mean price and volume. |
| This is not to argue against the efficacy of indicators. But in the same way that indicators can be a boon, they can also be a crutch, keeping us from seeing what is fundamentally going on with a given asset -- whether that asset is a stock or a futures contract, or an internationally traded currency pair or cross. I've tried to get into the habit of doing at least a cursory scan of various stocks, indexes, and sectors with the "Hide studies" box checked before pulling out the technical toolbox and going to work on the chart with my favorite suite of indicators. |

|
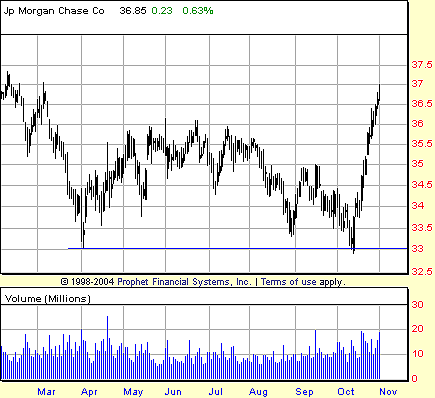
| FIGURE 1: JP MORGAN, DAILY. JP Morgan retests the lows of early April, when the bull market in stocks began, in mid-October. The failure to follow through on the downside in October set up the opportunity for a major upside later in the month. |
| Graphic provided by: Prophet Financial, Inc. |
| |
| In some ways, this look at JP Morgan (JPM) comes courtesy of such a "studies-free" scan (Figure 1). With indicators removed, I tend to be drawn toward some of the more basic relationships between price and volume, support and resistance, and the like. And it was a consideration of what a financial stock like JP Morgan was doing during a recent test of support that led to uncovering this technical stand-by as a guide to the near-term look at JPM. |

|
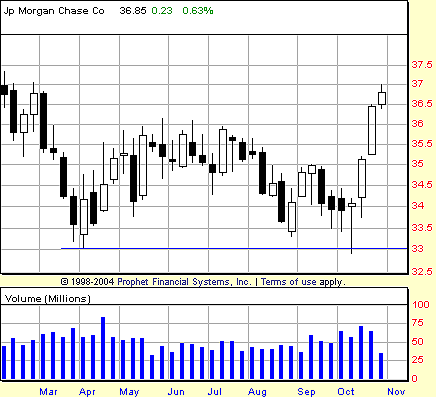
| FIGURE 2: JP MORGAN, WEEKLY. The 2B test of bottom is especially clear in this weekly chart. Even with an entry at the same level as the high of the first week of April, there would have been plenty of gain for traders riding JP Morgan higher in the second half of October. |
| Graphic provided by: Prophet Financial, Inc. |
| |
| There are a number of ways of looking at the 2B test (Figure 2). One way is to consider the 2B test to be a bear or bull trap in which traders are baited by the presence of a new low or high into believing that a trend has resumed, only to find themselves caught up in a surprising reversal. Another way of looking at the 2B test is to see it simply as a test of support or resistance. In any case, the 2B test is one of the more reliable ways of spotting turning points in markets, points that trader and author Victor Sperandeo has noted are "where fortunes are made." While trading such opportunities requires more discipline in some ways than does trading breakouts or other technical setups, the rewards of the successfully traded reversal are understandably significant. In the case of JP Morgan, the key level was 33, the point at which the declines going into the spring of 2005 found support and prices reversed. This reversal lasted until mid-June, when shares of JPM began to sag and, eventually, retreat. This retreat lasted until October, when prices again slid toward -- and eventually tested -- the 33 level. How do prices react when they retest support levels? Are there closes beneath those levels, or merely intraday penetrations? This is an important question when trying to understand the reality of support and resistance levels. Is a support level any more valid because prices come close, but never actually touch the support level? Is a support level any less valid because prices penetrate the level on an intraday -- or intrabar -- basis? While it is true that each circumstance is unique, what tends to hold true for all instances is that the absence of follow-through in the direction of the test tends to strongly suggest that prices will find support near -- if not specifically "at" -- the noted support level. |
| This was clearly the case with JP Morgan. The support level was not strong enough to repel any penetration, but the penetration that did take place was fleeting. As the daily chart shows, prices opened below the support level, but closed strongly above it. On the weekly chart, prices dipped below the support level on an intraweek basis, but finished the week well above the support level. In both instances, it goes without saying, follow-through to the downside was nonexistent. With regard to the specifics of the 2B setup, an entry above the high of the initial low in earliest April would have provided for a solid trading opportunity in both the daily and weekly charts. In the case of the former, an entry at 33.63 would have been ideal. In the case of the latter, weekly setup, an entry at 34.77 would have provided results that would have been only slightly less rewarding. |
Technical Writer for Technical Analysis of STOCKS & COMMODITIES magazine, Working-Money.com, and Traders.com Advantage.
| Title: | Technical Writer |
| Company: | Technical Analysis, Inc. |
| Address: | 4757 California Avenue SW |
| Seattle, WA 98116 | |
| Phone # for sales: | 206 938 0570 |
| Fax: | 206 938 1307 |
| Website: | www.Traders.com |
| E-mail address: | DPenn@traders.com |
Traders' Resource Links | |
| Charting the Stock Market: The Wyckoff Method -- Books | |
| Working-Money.com -- Online Trading Services | |
| Traders.com Advantage -- Online Trading Services | |
| Technical Analysis of Stocks & Commodities -- Publications and Newsletters | |
| Working Money, at Working-Money.com -- Publications and Newsletters | |
| Traders.com Advantage -- Publications and Newsletters | |
| Professional Traders Starter Kit -- Software | |
Click here for more information about our publications!
Comments
Date: 11/02/05Rank: 3Comment:
Date: 11/19/05Rank: 4Comment:

|

Request Information From Our Sponsors
- StockCharts.com, Inc.
- Candle Patterns
- Candlestick Charting Explained
- Intermarket Technical Analysis
- John Murphy on Chart Analysis
- John Murphy's Chart Pattern Recognition
- John Murphy's Market Message
- MurphyExplainsMarketAnalysis-Intermarket Analysis
- MurphyExplainsMarketAnalysis-Visual Analysis
- StockCharts.com
- Technical Analysis of the Financial Markets
- The Visual Investor
- VectorVest, Inc.
- Executive Premier Workshop
- One-Day Options Course
- OptionsPro
- Retirement Income Workshop
- Sure-Fire Trading Systems (VectorVest, Inc.)
- Trading as a Business Workshop
- VectorVest 7 EOD
- VectorVest 7 RealTime/IntraDay
- VectorVest AutoTester
- VectorVest Educational Services
- VectorVest OnLine
- VectorVest Options Analyzer
- VectorVest ProGraphics v6.0
- VectorVest ProTrader 7
- VectorVest RealTime Derby Tool
- VectorVest Simulator
- VectorVest Variator
- VectorVest Watchdog
