HOT TOPICS LIST
- MACD
- Fibonacci
- RSI
- Gann
- ADXR
- Stochastics
- Volume
- Triangles
- Futures
- Cycles
- Volatility
- ZIGZAG
- MESA
- Retracement
- Aroon
INDICATORS LIST
LIST OF TOPICS
PRINT THIS ARTICLE
by Paolo Pezzutti
A combination of setups provides guidance for a short-term trade.
Position: N/A
Paolo Pezzutti
Author of the book "Trading the US Markets - A Comprehensive Guide to US Markets for International Traders and Investors" - Harriman House (July 2008)
PRINT THIS ARTICLE
CANDLESTICK CHARTING
A Short-Term Buy Setup On Chevron
10/31/05 09:23:17 AMby Paolo Pezzutti
A combination of setups provides guidance for a short-term trade.
Position: N/A
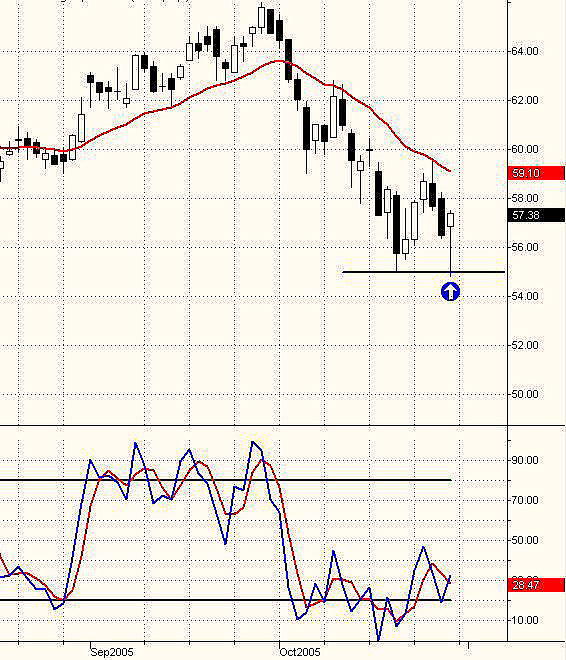
| Chevron Oil Corp. hit its high of 65.98 at the end of September 2005. Since then, prices dropped to a low of $55.22 in less than a month, printing an a-b-c correction. Given the speed of this move, it appears that an impulse to the downside was printed. The stock pulled back to test the moving average at $59.48 and then retested the previous low during last Friday session. This is a very interesting bar that combines several buy setups (Figure 1). Let's examine some of them. The bar is a candlestick hammer. It can be recognized by the fact that the real body is at the upper end of the trading range, the long lower shadow is more than twice the height of the real body and, finally, it has a very short upper shadow. You know that the longer the lower shadow, the shorter the upper shadow; and the smaller the real body, the more meaningful the bullish hammer. A positive divergence of the fast stochastic helps qualifying the setup. |

|
| FIGURE 1: CVH. Chevron prints a buy setup on the daily chart. |
| Graphic provided by: TradeStation. |
| |
| The bar has been a successful Turtle Soup setup, which was introduced in the famous book Street Smarts by Linda Bradford Raschke and Laurence A. Connors. The aim of the pattern is to profit from false breakouts. It is a typical swing trading pattern, working well in volatile markets. The rules for buys are: - Today, you must have a new 20-day low, and the previous 20-day low must be at least four days earlier. - After the new low has occurred, place an entry buy-stop five to 10 ticks above the previous 20-day low. Jeff Cooper's Turtle Soup expansion, as described in his book Hit And Run II, valid for the next trading session, is based on a Turtle Soup bar. If you have such a bar with a range greater than that any of the prior four sessions, then you will go long one tick above the previous day's high. Once filled, you will use a trailing stop to lock in profits. The concept is that a false breakout combined with a range expansion will squeeze weak breakout players, who are caught on the wrong side of the market. The high-volatility environment is a profit opportunity. |
| The bar is a Lizard. Jeff Cooper, in his book, describes this very simple pattern, which has the following rules: -The bar has open and close at the top 25% of the bar range. - The bar prints a 10-day low. - Place a buy-stop order the next day one tick above the previous day's high. - Once filled, sell the same day at the close. Basically, this pattern is a hammer with specific qualifications required. |
| The concept of all these patterns is that you profit from an exhaustion move. The last sellers bring prices down to extreme levels before strong hands enter the market. The volatility is high and it is a very short-term pattern. The stop-loss must be clearly identified and applied with discipline, given the fast market conditions in which you are trading. On Monday, many traders will look to trade the day to the upside. That would test the bears' determination right after the open; this is a viable tactic, especially after a weak open. It would be interesting and very profitable, however, to trade the unlikely failure of this reversal pattern with the continuation of the down movement in a fast and volatile environment. |
Author of the book "Trading the US Markets - A Comprehensive Guide to US Markets for International Traders and Investors" - Harriman House (July 2008)
| Address: | VIA ROBERTO AGO 26 POSTAL CODE 00166 |
| Rome, ITALY | |
| Phone # for sales: | +393357540708 |
| E-mail address: | pezzutti.paolo@tiscali.it |
Click here for more information about our publications!
Comments
Date: 11/01/05Rank: 5Comment:
Date: 11/01/05Rank: 3Comment:
Date: 11/02/05Rank: 3Comment:
Date: 11/02/05Rank: Comment:
Please how can I get a software/tool that can display a graphic representation of stock movements. ie charts.
Email. larrychukwu@yahoo.co.uk

Request Information From Our Sponsors
- StockCharts.com, Inc.
- Candle Patterns
- Candlestick Charting Explained
- Intermarket Technical Analysis
- John Murphy on Chart Analysis
- John Murphy's Chart Pattern Recognition
- John Murphy's Market Message
- MurphyExplainsMarketAnalysis-Intermarket Analysis
- MurphyExplainsMarketAnalysis-Visual Analysis
- StockCharts.com
- Technical Analysis of the Financial Markets
- The Visual Investor
- VectorVest, Inc.
- Executive Premier Workshop
- One-Day Options Course
- OptionsPro
- Retirement Income Workshop
- Sure-Fire Trading Systems (VectorVest, Inc.)
- Trading as a Business Workshop
- VectorVest 7 EOD
- VectorVest 7 RealTime/IntraDay
- VectorVest AutoTester
- VectorVest Educational Services
- VectorVest OnLine
- VectorVest Options Analyzer
- VectorVest ProGraphics v6.0
- VectorVest ProTrader 7
- VectorVest RealTime Derby Tool
- VectorVest Simulator
- VectorVest Variator
- VectorVest Watchdog
