HOT TOPICS LIST
- MACD
- Fibonacci
- RSI
- Gann
- ADXR
- Stochastics
- Volume
- Triangles
- Futures
- Cycles
- Volatility
- ZIGZAG
- MESA
- Retracement
- Aroon
INDICATORS LIST
LIST OF TOPICS
PRINT THIS ARTICLE
by Paolo Pezzutti
The stochastic RSI is an oscillator of an oscillator useful in managing trending markets.
Position: N/A
Paolo Pezzutti
Author of the book "Trading the US Markets - A Comprehensive Guide to US Markets for International Traders and Investors" - Harriman House (July 2008)
PRINT THIS ARTICLE
TECHNICAL INDICATORS
The Stochastic RSI
10/31/05 08:50:19 AMby Paolo Pezzutti
The stochastic RSI is an oscillator of an oscillator useful in managing trending markets.
Position: N/A
| The relative strength index (RSI) is a popular oscillator that traders use to identify overbought and oversold conditions. As with most oscillators, the RSI is best suited for trading range markets. The formula is: RSI = 100 - (100/[1+RS]) RS = Relative strength = The average of the up closes over the calculation period (for example, 10 bars, 14 bars) divided by the average of the down closes over the calculation period. If you are in a trending market, let's say an uptrend, the RSI will repeatedly indicate overbought conditions, providing a number of false signals. In addition, the RSI peaks never reach the oversold level, so the indicator fails to generate buy signals. A solution to this problem is to apply the stochastic oscillator to the RSI. This occurs because oscillators typically do not adjust to the market's ever-changing cycle length. The stochastic RSI compares the current oscillator reading to the range of its readings over a given period. |
| The stochastic indicator is an oscillator that consists of two lines: %K and a moving average of %K, called %D. The basic stochastic calculation compares the most recent close to the price range (high of the range - low of the range) over a particular period. The formula is: %K = 100*{(Close-Ln)/(Hn-Ln)} Hn is the highest price of the most recent n days. Ln is the lowest price of the most recent n days. The second line, %D, is a three-period simple moving average of %K. The formula is referred to as "fast" stochastics. A smoothed version of the indicator, where the original %D line becomes a new %K line and a three-period average of this line becomes the new %D line, is referred to as "slow" stochastic. To create the stochastic RSI, simply substitute the RSI reading for price. The first implementation was proposed by Tushar Chande and Stanley Kroll in their book, The New Technical Trader. Since then, there have been many modifications to the code in order to further smooth the activity of this indicator. The result is an indicator that generates overbought and oversold readings and adjusts to the most recent RSI readings. The RSI uses a 14-bar lookback period, while the stochastic oscillator uses 14 days as a default, but you can adapt it to your own needs. The stochastic RSI readings represent where the current RSI reading is (on a percentage basis) relative to the range of the RSI over the past 14 days. The indicator is more sensitive than the original RSI. You might also want to look at modifying the indicator further to adapt it to the ever-changing cycles length. |

|
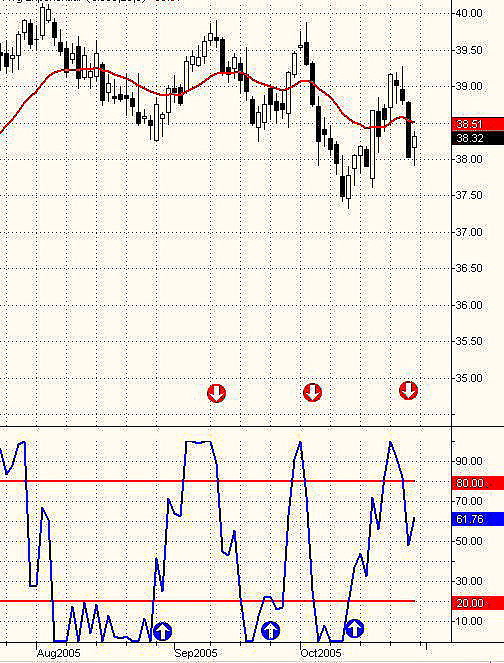
| FIGURE 1: QQQQ. The stochastic RSI provides excellent signals in a sideways market. |
| Graphic provided by: TradeStation. |
| |
| Let's see this indicator in action. In Figure 1, the QQQQ daily chart displays the stochastic RSI. You can see that the trading range conditions over the past three months have been perfectly managed by the indicator that provided timely buy and sell signals. This is expected, however, from an oscillator during these market phases. |

|
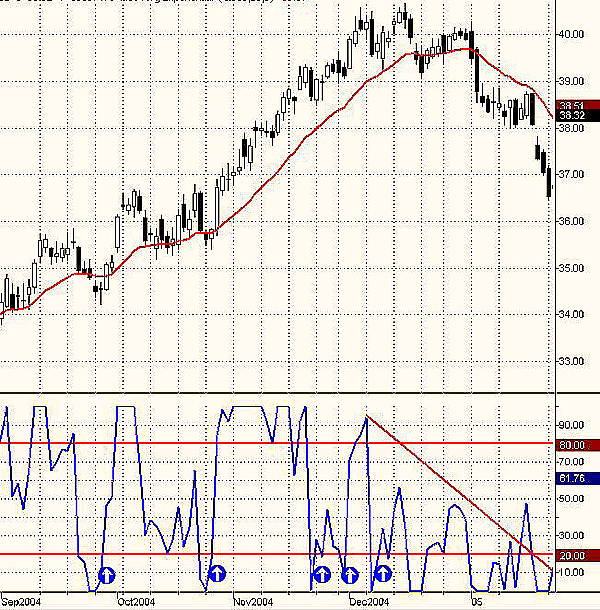
| FIGURE 2: QQQQ UPTREND. During an uptrend, the indicator provided good entry signals during pullbacks. |
| Graphic provided by: TradeStation. |
| |
| In Figure 2, you can see a prolonged uptrend of QQQQ. In this case, note that the indicator had an added value compared to other oscillators. In fact, it provided nice entry points giving oversold readings during the pullbacks. At the end of the trend, negative divergences alerted traders that weakness was ahead. Trends render typical oscillator signals useless. However, this oscillator of an oscillator can help you to be more effective in all types of market conditions. Of course, the intrinsic issues of an oscillator are not completely solved. You will continue to have false signals on occasion. But this implementation could represent the beginning of a research that will reveal more sophisticated approaches to the problem. |
Author of the book "Trading the US Markets - A Comprehensive Guide to US Markets for International Traders and Investors" - Harriman House (July 2008)
| Address: | VIA ROBERTO AGO 26 POSTAL CODE 00166 |
| Rome, ITALY | |
| Phone # for sales: | +393357540708 |
| E-mail address: | pezzutti.paolo@tiscali.it |
Click here for more information about our publications!
Comments
Date: 11/01/05Rank: 5Comment:
Date: 11/01/05Rank: 3Comment:
Date: 12/29/06Rank: 3Comment:

Request Information From Our Sponsors
- StockCharts.com, Inc.
- Candle Patterns
- Candlestick Charting Explained
- Intermarket Technical Analysis
- John Murphy on Chart Analysis
- John Murphy's Chart Pattern Recognition
- John Murphy's Market Message
- MurphyExplainsMarketAnalysis-Intermarket Analysis
- MurphyExplainsMarketAnalysis-Visual Analysis
- StockCharts.com
- Technical Analysis of the Financial Markets
- The Visual Investor
- VectorVest, Inc.
- Executive Premier Workshop
- One-Day Options Course
- OptionsPro
- Retirement Income Workshop
- Sure-Fire Trading Systems (VectorVest, Inc.)
- Trading as a Business Workshop
- VectorVest 7 EOD
- VectorVest 7 RealTime/IntraDay
- VectorVest AutoTester
- VectorVest Educational Services
- VectorVest OnLine
- VectorVest Options Analyzer
- VectorVest ProGraphics v6.0
- VectorVest ProTrader 7
- VectorVest RealTime Derby Tool
- VectorVest Simulator
- VectorVest Variator
- VectorVest Watchdog
