HOT TOPICS LIST
- MACD
- Fibonacci
- RSI
- Gann
- ADXR
- Stochastics
- Volume
- Triangles
- Futures
- Cycles
- Volatility
- ZIGZAG
- MESA
- Retracement
- Aroon
INDICATORS LIST
LIST OF TOPICS
PRINT THIS ARTICLE
by Gary Grosschadl
This huge specialty retailer of consumer electronics may be poised for another large move.
Position: Buy
Gary Grosschadl
Independent Canadian equities trader and technical analyst based in Peterborough
Ontario, Canada.
PRINT THIS ARTICLE
ASCENDING TRIANGLES
Best Buy Co. May Be Best Buy
10/31/05 08:01:06 AMby Gary Grosschadl
This huge specialty retailer of consumer electronics may be poised for another large move.
Position: Buy
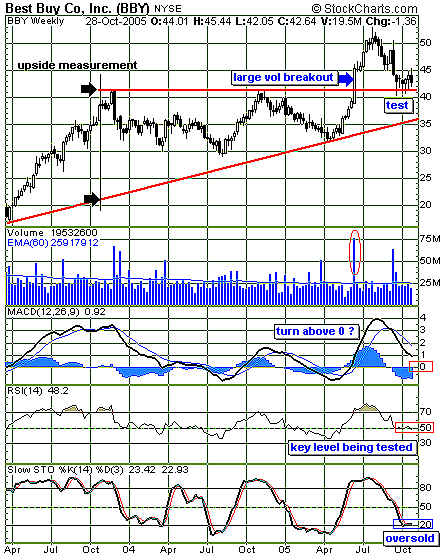
| The formation depicted on this weekly chart (Figure 1) shows a large ascending triangle. This is considered to be a bullish formation and is often a continuation pattern. Since the previous thrust was an upmove close to $10, the continuation refers to additional upside. |
| Figure 1 shows a large volume breakout from early summer. This indicates good conviction from the buyers that the upside move should continue -- and it did, from $45 to $53. Since then, it has endured a sizable correction to nearly $40. Note the long tails of several candlesticks, hinting that support was found. As is often the case with breakout formations, the breakout zone is eventually tested as a future support level. |

|
| FIGURE 1: BBY WEEKLY. A large classic formation is shown on this multiyear weekly chart. |
| Graphic provided by: StockCharts.com. |
| |
| Should this support level hold, then a larger upleg may well occur. This upmove can be measured by applying the widest part of the triangle to the break above the top trendline. This is shown as the distance between the black arrows being 20 points. This translates to a possible thrust up to ~ $61. |
| A look at several indicators shows some bounce potential here. The relative strength index (RSI) shows an attempt to bounce off the often-key 50 level, while the stochastics oscillator shows an oversold condition at the 20 level. Less convincing is the moving average convergence/divergence (MACD). However, this indicator has room to turn above the zero level and can lag the other "quicker" indicators. |
| Should bearish forces turn the tide akin to the Grinch spoiling the holiday shopping season, then this stock could find itself bearishly back inside the ascending triangle. Until then, the bulls have the upper hand and may fuel a thrust to eventual new highs. |
Independent Canadian equities trader and technical analyst based in Peterborough
Ontario, Canada.
| Website: | www.whatsonsale.ca/financial.html |
| E-mail address: | gwg7@sympatico.ca |
Click here for more information about our publications!
Comments
Date: 10/31/05Rank: 5Comment:

Request Information From Our Sponsors
- StockCharts.com, Inc.
- Candle Patterns
- Candlestick Charting Explained
- Intermarket Technical Analysis
- John Murphy on Chart Analysis
- John Murphy's Chart Pattern Recognition
- John Murphy's Market Message
- MurphyExplainsMarketAnalysis-Intermarket Analysis
- MurphyExplainsMarketAnalysis-Visual Analysis
- StockCharts.com
- Technical Analysis of the Financial Markets
- The Visual Investor
- VectorVest, Inc.
- Executive Premier Workshop
- One-Day Options Course
- OptionsPro
- Retirement Income Workshop
- Sure-Fire Trading Systems (VectorVest, Inc.)
- Trading as a Business Workshop
- VectorVest 7 EOD
- VectorVest 7 RealTime/IntraDay
- VectorVest AutoTester
- VectorVest Educational Services
- VectorVest OnLine
- VectorVest Options Analyzer
- VectorVest ProGraphics v6.0
- VectorVest ProTrader 7
- VectorVest RealTime Derby Tool
- VectorVest Simulator
- VectorVest Variator
- VectorVest Watchdog
