HOT TOPICS LIST
- MACD
- Fibonacci
- RSI
- Gann
- ADXR
- Stochastics
- Volume
- Triangles
- Futures
- Cycles
- Volatility
- ZIGZAG
- MESA
- Retracement
- Aroon
INDICATORS LIST
LIST OF TOPICS
PRINT THIS ARTICLE
by Sean Moore
K-Mart Corporation [KM] has been in a steady downtrend for over a year. When will this long-term trend be broken? Well, there's not much sign yet, but the stock could be considered a good value.
Position: N/A
Sean Moore
Traders.com Staff Writer.
PRINT THIS ARTICLE
STOCKS
Value In The Market?
08/01/00 08:35:32 AMby Sean Moore
K-Mart Corporation [KM] has been in a steady downtrend for over a year. When will this long-term trend be broken? Well, there's not much sign yet, but the stock could be considered a good value.
Position: N/A
| One of the main investment strategies used by mutual fund companies is to buy stocks that are considered to be a good value. You have probably heard of growth funds vs. value funds. Growth funds consist of stocks that have positive fundamentals and rising prices. Hopefully, this good news and positive growth will lead to rising profits. Value funds consist of stocks with lower price-to-earnings ratio and lower price-to-book ratios. These stocks are generally undervalued by the market. Value investing is considered a conservative investment style since the likelihood of an increase in value is greater if a reversal occurs. |
| K-Mart Corporation [KM] could be considered a value stock. With prices declining from over $20 per share to under $7 in the past year, K-Mart has been unable to break out of its steady decline. As part of the struggling retail sector, K-Mart has been unable to keep pace with the more successful retailers, namely Wal-Mart and Target. But, with over 2,000 stores, a new CEO, and significant Internet development, K-Mart could still be considered a good value at $7 per share, despite the recent announcement of 72 store closures and significant attempts to control inventory. |

|
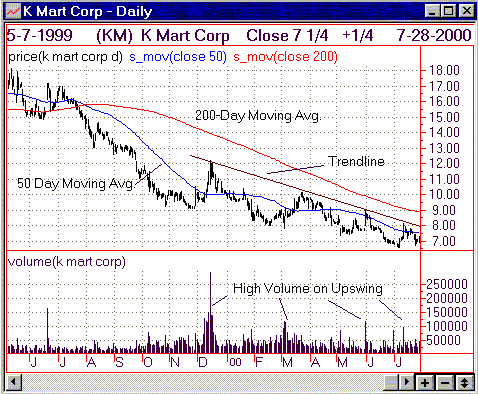
| Figure 1: Daily price chart for K-Mart Corp [KM]. Look for a sustained breakout above the long-term downward trendline. |
| Graphic provided by: Window. |
| |
| Ok, enough about the fundamentals, let's look at K-Mart from a technical standpoint. What we're really looking for here is a reversal out of this downward price movement. Over the past six months, there have been some signs that a reversal could occur, with positive movement on high volume (see volume spikes in Figure 1), but each time the rise has fallen flat and declined to a lower low. These volume spikes could be signs of accumulation. The price could remain at this bottom level for some time since there seems to be some support developing at the $7 area. Look for the price to cross above its 50- or 200- day moving average and break above this long-term downward trend before you buy. Movement above a longer-term moving average, like the 50- or 200-day moving average, could be a positive sign that the long-term downward trend has been broken. The moving average lines and trendline are shown in Figure 1. If the stock can gain momentum from these volume spikes, a breakout above this trendline could occur. |
| There is certainly something to be said for buying stocks whose value may have increased because of declining prices. However, there needs to be some sign that a reversal is going to occur. Watch the technicals and look for bottom formations, breakouts above the downward trends, and rising volume on upswings. Will KM break out of this downward spiral and reach the $18 level again? Well, it's hard to say right now, but because of the value, I'm keeping my eye on it. |
Traders.com Staff Writer.
| Title: | Project Engineer |
| Company: | Technical Analysis, Inc. |
| Address: | 4757 California Ave. SW |
| Seattle, WA 98116 | |
| Phone # for sales: | 206 938 0570 |
| Fax: | 206 938 1307 |
| Website: | Traders.com |
| E-mail address: | smoore@traders.com |
Traders' Resource Links | |
| Charting the Stock Market: The Wyckoff Method -- Books | |
| Working-Money.com -- Online Trading Services | |
| Traders.com Advantage -- Online Trading Services | |
| Technical Analysis of Stocks & Commodities -- Publications and Newsletters | |
| Working Money, at Working-Money.com -- Publications and Newsletters | |
| Traders.com Advantage -- Publications and Newsletters | |
| Professional Traders Starter Kit -- Software | |
Click here for more information about our publications!
Comments

Request Information From Our Sponsors
- StockCharts.com, Inc.
- Candle Patterns
- Candlestick Charting Explained
- Intermarket Technical Analysis
- John Murphy on Chart Analysis
- John Murphy's Chart Pattern Recognition
- John Murphy's Market Message
- MurphyExplainsMarketAnalysis-Intermarket Analysis
- MurphyExplainsMarketAnalysis-Visual Analysis
- StockCharts.com
- Technical Analysis of the Financial Markets
- The Visual Investor
- VectorVest, Inc.
- Executive Premier Workshop
- One-Day Options Course
- OptionsPro
- Retirement Income Workshop
- Sure-Fire Trading Systems (VectorVest, Inc.)
- Trading as a Business Workshop
- VectorVest 7 EOD
- VectorVest 7 RealTime/IntraDay
- VectorVest AutoTester
- VectorVest Educational Services
- VectorVest OnLine
- VectorVest Options Analyzer
- VectorVest ProGraphics v6.0
- VectorVest ProTrader 7
- VectorVest RealTime Derby Tool
- VectorVest Simulator
- VectorVest Variator
- VectorVest Watchdog
