HOT TOPICS LIST
- MACD
- Fibonacci
- RSI
- Gann
- ADXR
- Stochastics
- Volume
- Triangles
- Futures
- Cycles
- Volatility
- ZIGZAG
- MESA
- Retracement
- Aroon
INDICATORS LIST
LIST OF TOPICS
PRINT THIS ARTICLE
by David Penn
Ever throw a "call the bottom" party and EVERYBODY came?
Position: N/A
David Penn
Technical Writer for Technical Analysis of STOCKS & COMMODITIES magazine, Working-Money.com, and Traders.com Advantage.
PRINT THIS ARTICLE
MACD
About That Bottom
10/26/05 11:34:30 AMby David Penn
Ever throw a "call the bottom" party and EVERYBODY came?
Position: N/A
| In recent days, it has been physically impossible to throw a brick without hitting somebody who has called for a bottom in the stock market. One talented technical analyst whose radio program I listen to regularly went so far as to analogize the mid-October lows as the "birth of a little baby bull ... blue eyes, beautiful dark hair. ..." But others have been no less enthusiastic in their embrace of an oversold bounce as the spitting image of a major bottom. Jim Cramer, whose Mad Money program on CNBC is among the most worth-watching programs on cable, donned his surgeon's scrubs as he intoned "The bull is alive!" on a set mocked up to look like an operation room. |
| Maybe the markets have bottomed. After all, April may be the cruelest month, but October is known for its bottoms--bottoms made all the more infamous by the plunging descents that preceded them. Say "October" to a market watcher and visions of 1929, 1987, and 2002 -- three of the more memorable market bottoms -- spring immediately to mind. |

|
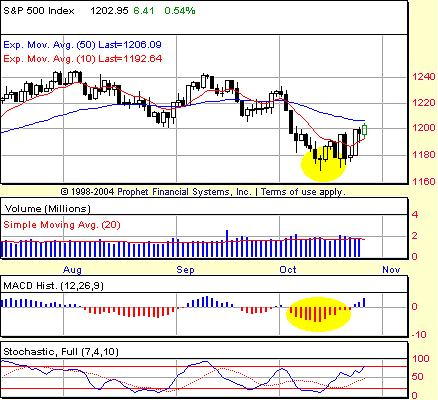
| FIGURE 1: DAILY S&P 500 MACD HISTOGRAM. The depth of the MACD histogram in mid-October suggests that lower prices are still ahead for the S&P 500, even as it bounds toward a test of the 50-day EMA. |
| Graphic provided by: Prophet Financial, Inc. |
| |
| I do want to separate those (such as Gary Kaltbaum, technical analyst with TradingMarkets.com and host of the "Investor's Edge" radio program) who have noted that the market action in mid-October was indicative of a near-term low from those who have triumphantly claimed that those lows were THE BOTTOM. The "near-term low" call is sensible and supported by the evidence. The hammer candlestick on October 13 and the bullish follow-through day on October 19 (accompanied by particularly powerful volume) clearly marked a low of at least intermediate-term significance. And given the degree to which prices were extended to the downside (compare the value of the 50-day exponential moving average (EMA) in blue with the 10-day EMA in red with the Standard & Poor's 500 on October 13 to see what I mean), it was reasonable to believe that a bounce of some sort would materialize sooner than later. But as I asked at the outset, how is it possible that everybody and his brother will be right in calling the mid-October lows "THE BOTTOM"? Ignoring the obvious, socionomic fact that it is hard to imagine a bottom in the markets before there is any clarity on the federal indictments looming over members of the White House staff, there are a number of technical features to the current bounce in the market that technicians, at least, should be mindful of before committing themselves to the cause of THE BOTTOM. Consider, first, the daily moving average convergence/divergence (MACD) histogram highlighted in Figure 1. As I have written frequently, new lows in the MACD histogram often signal lower lows in price to come -- usually after a bounce of some significance. We can see this pattern in a number of dramatic historical instances, as I noted in a recent Traders.com Advantage article ("Deeper Into October," October 18, 2005). Seen this way, the bounce in the S&P 500 that has occurred since the middle of the month is quite possibly part of a typical pattern on the way to a bottom -- one that is far more likely to occur when the MACD histogram is actually making higher lows rather than lower lows. A look at the S&P 500 on the hourly time frame provides further reason for caution with regard to the upside. |

|
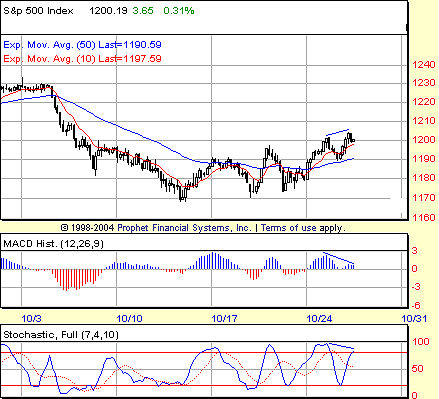
| FIGURE 2: HOURLY S&P 500 MACD HISTOGRAM. Higher highs in the hourly S&P 500 are matched with lower highs in both the MACD histogram and the 7,10 stochastic oscillator. |
| Graphic provided by: Prophet Financial, Inc. |
| |
| Note the chart in Figure 2. As the S&P 500 was breaking out above 1200, negative divergences were developing in both the MACD histogram and in the stochastic oscillator. The fact that both indicators are developing negative divergences (higher highs in price not matched by higher highs in the indicators) is an especially demonstrative warning that the upside is most likely limited. It is at this point that traders -- especially technicians -- should begin to consult other tools and setups that have successfully marked tops and turning points in the markets for further confirmation. Candlestick patterns, 2B tests, and Turtle Soup setups are only a few of such methods that technical traders can use to confirm any top that might be showing itself in the charts. |
| I should also add that the forementioned thesis with regard to the MACD histogram seems to be borne out here as well. Note how the higher histogram readings come not with the current high in the S&P 500, but with a previous, lower high. This is one of the ways in which the MACD histogram can be helpful in determining when a market is running out of momentum -- in this case, to the upside. I've already provided some downside targets worth keeping an eye out for in another recent Traders.com Advantage article ("Waves Working Lower," October 18, 2005), so there's no need to repeat them here. Suffice it to say that if this analysis is correct and there are lower lows to come in the S&P 500, then there is every reason to believe that the S&P 500 will test the lows for the year (approximately 1136.15) before a truly tradable move to the upside materializes. |
Technical Writer for Technical Analysis of STOCKS & COMMODITIES magazine, Working-Money.com, and Traders.com Advantage.
| Title: | Technical Writer |
| Company: | Technical Analysis, Inc. |
| Address: | 4757 California Avenue SW |
| Seattle, WA 98116 | |
| Phone # for sales: | 206 938 0570 |
| Fax: | 206 938 1307 |
| Website: | www.Traders.com |
| E-mail address: | DPenn@traders.com |
Traders' Resource Links | |
| Charting the Stock Market: The Wyckoff Method -- Books | |
| Working-Money.com -- Online Trading Services | |
| Traders.com Advantage -- Online Trading Services | |
| Technical Analysis of Stocks & Commodities -- Publications and Newsletters | |
| Working Money, at Working-Money.com -- Publications and Newsletters | |
| Traders.com Advantage -- Publications and Newsletters | |
| Professional Traders Starter Kit -- Software | |
Click here for more information about our publications!
Comments
Date: 10/26/05Rank: 4Comment:
Date: 10/31/05Rank: 5Comment:

Request Information From Our Sponsors
- StockCharts.com, Inc.
- Candle Patterns
- Candlestick Charting Explained
- Intermarket Technical Analysis
- John Murphy on Chart Analysis
- John Murphy's Chart Pattern Recognition
- John Murphy's Market Message
- MurphyExplainsMarketAnalysis-Intermarket Analysis
- MurphyExplainsMarketAnalysis-Visual Analysis
- StockCharts.com
- Technical Analysis of the Financial Markets
- The Visual Investor
- VectorVest, Inc.
- Executive Premier Workshop
- One-Day Options Course
- OptionsPro
- Retirement Income Workshop
- Sure-Fire Trading Systems (VectorVest, Inc.)
- Trading as a Business Workshop
- VectorVest 7 EOD
- VectorVest 7 RealTime/IntraDay
- VectorVest AutoTester
- VectorVest Educational Services
- VectorVest OnLine
- VectorVest Options Analyzer
- VectorVest ProGraphics v6.0
- VectorVest ProTrader 7
- VectorVest RealTime Derby Tool
- VectorVest Simulator
- VectorVest Variator
- VectorVest Watchdog
