HOT TOPICS LIST
- MACD
- Fibonacci
- RSI
- Gann
- ADXR
- Stochastics
- Volume
- Triangles
- Futures
- Cycles
- Volatility
- ZIGZAG
- MESA
- Retracement
- Aroon
INDICATORS LIST
LIST OF TOPICS
PRINT THIS ARTICLE
by Gary Grosschadl
The US Dollar Index has suffered a decline of 33% from the highs of 2002 to 2005. A reversal attempt is under way.
Position: Hold
Gary Grosschadl
Independent Canadian equities trader and technical analyst based in Peterborough
Ontario, Canada.
PRINT THIS ARTICLE
ASCENDING TRIANGLES
US Dollar Index: Running Out Of Gas In The Fast Lane?
10/26/05 08:25:03 AMby Gary Grosschadl
The US Dollar Index has suffered a decline of 33% from the highs of 2002 to 2005. A reversal attempt is under way.
Position: Hold
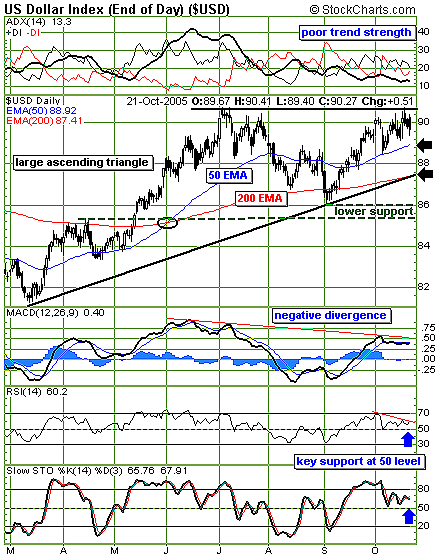
| This reversal attempt can be seen on a weekly and on a daily chart (Figure 1). A large ascending triangle has formed, which most often has a bullish bias. And as this is a rather large pattern, it may continue bouncing between the upwardly slanting bottom trendline and the top line of resistance. |
| This daily chart hints at this formation running out of gas at the top trendline and getting ready to test lower limits. Two important moving averages aptly show possible support tests within the triangle pattern. The 50-day exponential moving average (EMA) is currently at 88.92 and the ever-important 200-day EMA at 87.41. Note this matches the lower trendline, making it a more powerful line of support. Should this pattern be broken to the downside, the next support zone is indicated below 86. Note the previous points of support and resistance that form this support zone. |

|
| FIGURE 1: US DOLLAR INDEX. The daily chart shows a large reversal attempt from a bottom below 82. |
| Graphic provided by: StockCharts.com. |
| |
| Several indicators support the notion that there is not enough momentum to carry this index higher at this point. At the top of the chart, the average directional movement index (ADX) line shows a declining trend with an anemic value of 13.3. When this index remains below 20, that shows poor trend strength. The moving average convergence/divergence (MACD) indicator shows its own weakness in the form of a negative divergence to price action. Since the US dollar challenged the previous top without matching confirmation from the MACD, that indicates weakness. |
| The other two displayed indicators relate to the expected support test most likely at the 50-day EMA. This 50 level for the relative strength index (RSI) and the stochastic oscillator is often a key area of support or resistance. Failure here will likely challenge indicator levels of 30 for the RSI and 20 for the stochastic. |
| In summary, the overall pattern is bullish. However, in the short term, there is likely to be a lower support test. If the support test holds, this triangle pattern tightens with an eventual promise of an upside break. This could match a move roughly equal to the widest part of this ascending triangle (~ seven points). |
Independent Canadian equities trader and technical analyst based in Peterborough
Ontario, Canada.
| Website: | www.whatsonsale.ca/financial.html |
| E-mail address: | gwg7@sympatico.ca |
Click here for more information about our publications!
Comments
Date: 10/26/05Rank: 5Comment:

Request Information From Our Sponsors
- StockCharts.com, Inc.
- Candle Patterns
- Candlestick Charting Explained
- Intermarket Technical Analysis
- John Murphy on Chart Analysis
- John Murphy's Chart Pattern Recognition
- John Murphy's Market Message
- MurphyExplainsMarketAnalysis-Intermarket Analysis
- MurphyExplainsMarketAnalysis-Visual Analysis
- StockCharts.com
- Technical Analysis of the Financial Markets
- The Visual Investor
- VectorVest, Inc.
- Executive Premier Workshop
- One-Day Options Course
- OptionsPro
- Retirement Income Workshop
- Sure-Fire Trading Systems (VectorVest, Inc.)
- Trading as a Business Workshop
- VectorVest 7 EOD
- VectorVest 7 RealTime/IntraDay
- VectorVest AutoTester
- VectorVest Educational Services
- VectorVest OnLine
- VectorVest Options Analyzer
- VectorVest ProGraphics v6.0
- VectorVest ProTrader 7
- VectorVest RealTime Derby Tool
- VectorVest Simulator
- VectorVest Variator
- VectorVest Watchdog
