

HOT TOPICS LIST
- MACD
- Fibonacci
- RSI
- Gann
- ADXR
- Stochastics
- Volume
- Triangles
- Futures
- Cycles
- Volatility
- ZIGZAG
- MESA
- Retracement
- Aroon
INDICATORS LIST
LIST OF TOPICS
PRINT THIS ARTICLE
by Paolo Pezzutti
Candlestick charts can help traders filter out the noise. This pattern provides useful indications to anticipate market bottoms.
Position: N/A
Paolo Pezzutti
Author of the book "Trading the US Markets - A Comprehensive Guide to US Markets for International Traders and Investors" - Harriman House (July 2008)
PRINT THIS ARTICLE
CANDLESTICK CHARTING
The Morning Star Candlestick Pattern
10/24/05 11:01:54 AMby Paolo Pezzutti
Candlestick charts can help traders filter out the noise. This pattern provides useful indications to anticipate market bottoms.
Position: N/A
| Candlestick analysis allows traders to have an additional tool to try and anticipate trend reversals. Of the many candlestick signals, there are only a few that will occur most of the time. Among them, the morning star signal is one of the clearest, most symmetrical candlestick reversal patterns. The signal is formed after a downtrend and reveals features that identify a change in investor sentiment. The three-day signal consists of a long black body on the first day, usually one produced from the fear induced at the bottom of a long decline. The following day, the star day, gaps down, but the trading range remains small. This results from a day of indecision. The third day is a white candle day, with the bulls in control. The optimal morning star signal would have a gap before and after the star day. The star day can be made up of any formation that indicates a day of indecision; a doji and a spinning top are usually most common. The important factor is the confirmation of the bulls taking control the next day. That candle should consist of a closing more than halfway up the black candle two days prior. Consider also the opposite but equivalent signal, the evening star, to foretell prices heading down at the end of an uptrend. |
| There are some simple parameters that enhance the morning star's probabilities of success: - A long black candle and white candle demonstrate a dramatic change in investor sentiment - The more indecision of the star day, the greater the probability of a reversal - A gap between the first day and the second day adds to the probability of a reversal. A gap before and after the star day is even more desirable - A close of the third day, above the midpoint of the black candle of the first day, provides more potential to the reversal strength. The probability of a morning star signal reversing a trend becomes higher when you add some type of filter; for example, selecting oversold conditions of an indicator. Of course, this pattern is not the definitive solution to identify bottoms, but it can help the trader assess the market condition and potential for a reversal. When planning this type of trade, always expect the possibility of failure. It can bring high volatility. |
|
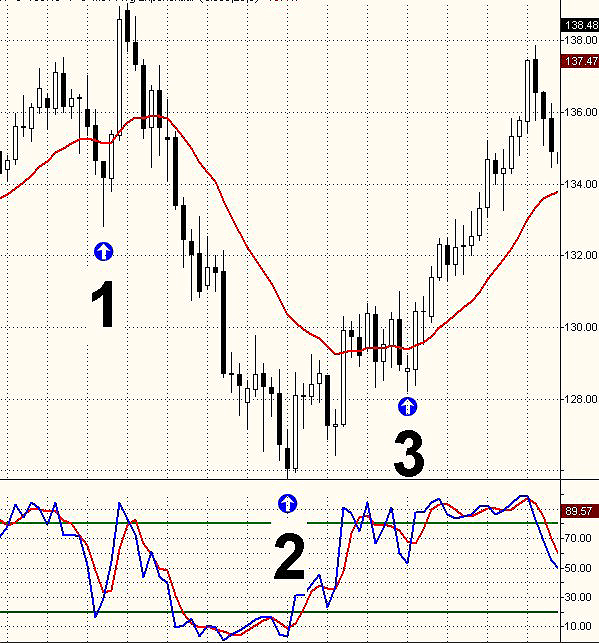
| FIGURE 1: MORNING STAR FORMATION. The morning star formation helps traders spot entry points at the end of a bear market. |
| Graphic provided by: TradeStation. |
| |
| Let's see some examples. In Figure 1, I will use a simple fast stochastics oscillator to assess oversold conditions. The first setup occurs in an intermediate uptrend during a correction. The oscillator is oversold. The white candle has a strong close. Note that prices exploded to the upside, trapping the bull side and moving to the downside very quickly. Proper risk control and money management are important to prevent you from a loss here. The second occurs at the end of a downtrend in oversold conditions. The third bar signals that the bulls have taken control. After the breakout, a pullback tests the bull's determination and then prices start a steady uptrend. The third setup occurs during a pause of the uptrend. The market is not oversold, so you might want to select your trades in a very discretionary manner. These patterns, similar to most others, should not be applied mechanically, but you must evaluate the context in which they appear. |
Author of the book "Trading the US Markets - A Comprehensive Guide to US Markets for International Traders and Investors" - Harriman House (July 2008)
| Address: | VIA ROBERTO AGO 26 POSTAL CODE 00166 |
| Rome, ITALY | |
| Phone # for sales: | +393357540708 |
| E-mail address: | pezzutti.paolo@tiscali.it |
Click here for more information about our publications!
Comments
Date:�10/24/05Rank:�4Comment:�

Request Information From Our Sponsors
- StockCharts.com, Inc.
- Candle Patterns
- Candlestick Charting Explained
- Intermarket Technical Analysis
- John Murphy on Chart Analysis
- John Murphy's Chart Pattern Recognition
- John Murphy's Market Message
- MurphyExplainsMarketAnalysis-Intermarket Analysis
- MurphyExplainsMarketAnalysis-Visual Analysis
- StockCharts.com
- Technical Analysis of the Financial Markets
- The Visual Investor
- VectorVest, Inc.
- Executive Premier Workshop
- One-Day Options Course
- OptionsPro
- Retirement Income Workshop
- Sure-Fire Trading Systems (VectorVest, Inc.)
- Trading as a Business Workshop
- VectorVest 7 EOD
- VectorVest 7 RealTime/IntraDay
- VectorVest AutoTester
- VectorVest Educational Services
- VectorVest OnLine
- VectorVest Options Analyzer
- VectorVest ProGraphics v6.0
- VectorVest ProTrader 7
- VectorVest RealTime Derby Tool
- VectorVest Simulator
- VectorVest Variator
- VectorVest Watchdog