HOT TOPICS LIST
- MACD
- Fibonacci
- RSI
- Gann
- ADXR
- Stochastics
- Volume
- Triangles
- Futures
- Cycles
- Volatility
- ZIGZAG
- MESA
- Retracement
- Aroon
INDICATORS LIST
LIST OF TOPICS
PRINT THIS ARTICLE
by Koos van der Merwe
A look at long-term charts of the DJIA and S&P 500 shows a recovery after the recent correction lasting into 2007 before a strong autumn. Two possible counts for the index are both suggesting strength AFTER a spring general election in Canada. Who will be the winner?
Position: Hold
Koos van der Merwe
Has been a technical analyst since 1969, and has worked as a futures and options trader with First Financial Futures in Johannesburg, South Africa.
PRINT THIS ARTICLE
ELLIOTT WAVE
Two Wave Counts For The Canadian TSX Index
10/19/05 03:13:25 PMby Koos van der Merwe
A look at long-term charts of the DJIA and S&P 500 shows a recovery after the recent correction lasting into 2007 before a strong autumn. Two possible counts for the index are both suggesting strength AFTER a spring general election in Canada. Who will be the winner?
Position: Hold
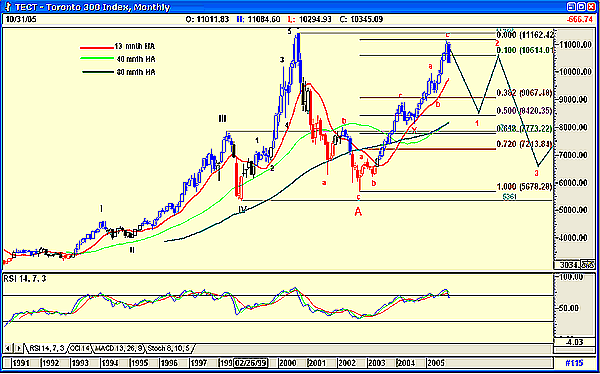
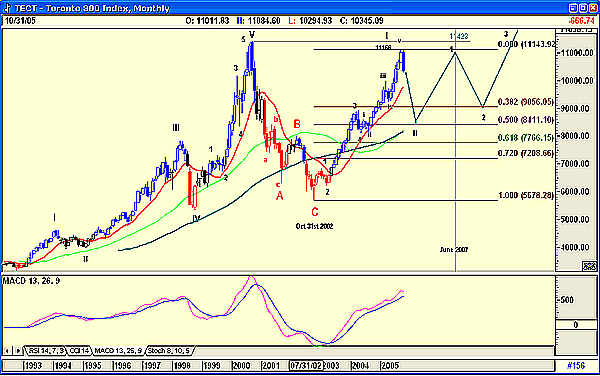
| I have presented two charts for the Toronto 300 TSX Index. Both are monthly charts, and both show wave counts that could be very real. Which one is correct? With the price of oil weakening; with Canadian finance minister Ralph Goodale's stance on income trusts hurting the senior citizens of the country to the extent that the minority government of Paul Martin could fall at the next election, probably due in the spring and with a falling Canadian dollar, the immediate future looks extremely bleak. |

|
| FIGURE 1: TORONOTO 300 INDEX, MONTHLY. Here's my preferred wave count. |
| Graphic provided by: AdvancedGET. |
| |
| My first chart is my preferred count of the index. Do note the following: -My wave count is suggesting that a B-wave is complete, and that the main trend is now down in five impulse waves. Figure 1 shows my suggested target for wave 1 down, at the 50% retracement level of 8240. -I show wave 2 rising to form what could be a triple top at a 90% retracement. I have found that a wave 2 is usually a 72% retracement, but I have chosen a 90% retracement because of a more definite triple top. Here I am being optimistic, and hopeful because of an expected rise in the price of oil. -I have based my time scale for the top of wave 2 on the Kondratieff wave count. (See "Forecasting Markets With Elliott And Kondratieff," Working Money, September 15, 2005.) -Finally, do note the relative strength index (RSI), which has given a sell signal. |

|
| FIGURE 2: TORONTO 300 INDEX, MONTHLY. Here's my alternate wave count, lying in my back pocket. |
| Graphic provided by: AdvancedGET. |
| |
| Figure 2 is my alternate count, to be found in my back pocket and whipped out at the slightest sign of a change. Note the following: -I am showing that the end of the bear market was on October 31, 2002, in line with a buy signal given by the moving average convergence/divergence (MACD) indicator. -That the move upward from that date was a complex impulse wave, culminating in a wave 1 to form a double top at 11166. -We can now expect a move down in a wave 2 that could be as low as 7208, a 72% retracement, but hopefully could also only be as low as 9056, a 38.2% retracement. In the chart I have suggested the 50% retracement level, in line with the fourth wave of lesser degree. This definition is common with a fourth wave retracement rather than a wave 2 correction, so it is suspect. -Note that I still see a rise into 2007 in line with my market forecast in Working Money. -Finally, do note the MACD oscillator, which is still positive. |
| Whichever count is true, the present trend is down probably into 2006 and after the general election. Markets hate uncertainty, and the possible fall of the present government, resulting from its antagonism of the senior vote, is creating that uncertainty. Whatever the election result, charts suggest that the uncertainty vanishes to an extent. With the reelection of the present government, the uncertainy could continue to exist. With the election of a conservative government, seniors are assured of a respectable income with their investments in income trusts, and the uncertainty is only in a change in government. The charts could therefore be anticipating that change. |
Has been a technical analyst since 1969, and has worked as a futures and options trader with First Financial Futures in Johannesburg, South Africa.
| Address: | 3256 West 24th Ave |
| Vancouver, BC | |
| Phone # for sales: | 6042634214 |
| E-mail address: | petroosp@gmail.com |
Click here for more information about our publications!
Comments
Date: 10/22/05Rank: 2Comment:

Request Information From Our Sponsors
- StockCharts.com, Inc.
- Candle Patterns
- Candlestick Charting Explained
- Intermarket Technical Analysis
- John Murphy on Chart Analysis
- John Murphy's Chart Pattern Recognition
- John Murphy's Market Message
- MurphyExplainsMarketAnalysis-Intermarket Analysis
- MurphyExplainsMarketAnalysis-Visual Analysis
- StockCharts.com
- Technical Analysis of the Financial Markets
- The Visual Investor
- VectorVest, Inc.
- Executive Premier Workshop
- One-Day Options Course
- OptionsPro
- Retirement Income Workshop
- Sure-Fire Trading Systems (VectorVest, Inc.)
- Trading as a Business Workshop
- VectorVest 7 EOD
- VectorVest 7 RealTime/IntraDay
- VectorVest AutoTester
- VectorVest Educational Services
- VectorVest OnLine
- VectorVest Options Analyzer
- VectorVest ProGraphics v6.0
- VectorVest ProTrader 7
- VectorVest RealTime Derby Tool
- VectorVest Simulator
- VectorVest Variator
- VectorVest Watchdog
