HOT TOPICS LIST
- MACD
- Fibonacci
- RSI
- Gann
- ADXR
- Stochastics
- Volume
- Triangles
- Futures
- Cycles
- Volatility
- ZIGZAG
- MESA
- Retracement
- Aroon
INDICATORS LIST
LIST OF TOPICS
PRINT THIS ARTICLE
by David Penn
An updated wave count takes a look at the S&P 500 since the August top.
Position: N/A
David Penn
Technical Writer for Technical Analysis of STOCKS & COMMODITIES magazine, Working-Money.com, and Traders.com Advantage.
PRINT THIS ARTICLE
ELLIOTT WAVE
Waves Working Lower
10/18/05 03:44:51 PMby David Penn
An updated wave count takes a look at the S&P 500 since the August top.
Position: N/A
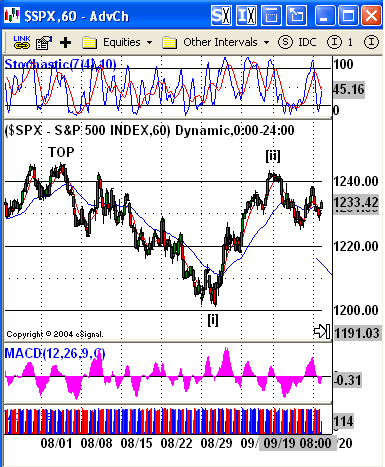
| My last Elliott wave-flavored offering for Traders.com Advantage was a little over a month ago ("Elliott Wave Update," September 9, 2005). In that article, I talked about the ending of a wave 1 decline and the possibility of the completion of a wave 2, countertrend move higher. To recap, the wave 1 decline is more colloquially known now as the "August decline," insofar as wave 1 was more or less completed within the 30 days of that final month of summer. The wave 2 countertrend advance that was also mentioned in that article developed in the first half of September and, typically of second waves, retraced a great deal of the August/wave 1 decline. Both waves 1 and 2 are shown in Figure 1. |

|
| FIGURE 1: Wave 1 was completed over the course of August, while wave 2--a countertrend bounce--took a little less than two weeks to retrace most of that previous move lower. |
| Graphic provided by: eSignal. |
| |
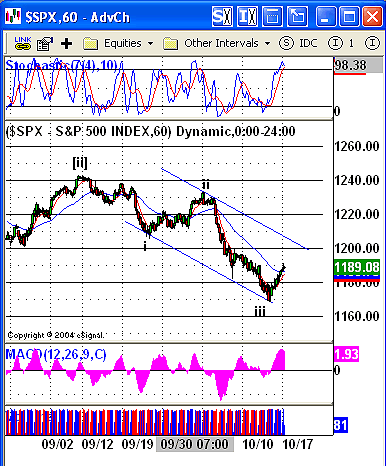
| Starting in the second half of September, however, the wave 2, countertrend bounce had run out of steam and rolled over into another decline. It is this decline, this set of five waves down, that the market finds itself working its way through in mid-October as Figure 2 shows in part. By the count in Figure 2, the market is working its way up into a wave 4 top. |

|
| FIGURE 2: At the subminuette level on this hourly chart, a wave 4 bounce should not take the S&P 500 into the price territory of wave 1. That suggests resistance near the 1210 level. |
| Graphic provided by: eSignal. |
| |
| Over the past few days since I first started working on this article, the Standard & Poor's 500 has rallied as high as 1190 before rolling over. The question now is whether the move higher from October 13 to October 17 represents the whole of wave 4 or is just a part of a larger wave 4 that will eventually bring the S&P 500 higher than its recent pivot at 1190. If I were going to guess, then I would say that the October 13 to October 17th bounce was the first leg of a three-part correction, with the fade on October 18 being the first parts of the second leg. If this turns out to be accurate, then traders and speculators should be on guard for a retest of the 1190 after a move (or a continued move) to test the 1170 level. |
| As an aside, looking at the size and duration of the wave 2 correction in late September, I suspect that wave 4 might be completed by option expiration on October 21. But that is just a guess. With some many waves counted--or at least tentatively counted--it is probably worthwhile to make some projections based on these counts. I use the method advocated by Robert Fischer in his book, Fibonacci Applications And Strategies For Traders--a book I have mentioned frequently in the past. We have a wave [i] low at about 1201 (see Figure 1. Brackets are used in place of circles). Let's call it the minuette level. With a top at 1246, this makes the minuette [i] (wave 1) 45 points. Multiply that 45 points times 1.618 to get 72.8, then subtract that 72.8 from the value at the minuette [i] (wave 1) low at 1201 and you get 1128.20. That is the minimum projection for the minuette [v] (wave 5) low that will complete a significantly sized set of five waves down and pave the way for a bounce that should be larger and more sustained than the smaller degree wave 2 (minuette [ii]) bounce in early September. Until there is a clear minuette [iii] low, we can't provide the other figure with which to average the above projection. Projections from the third wave tend to be lower than projections from the first wave, so any number we get from minuette [iii] is likely to be lower than 1128.20. We can also make projections from the smaller degree waves in September (see Figure 2). There we have a wave 1 from 1243 to 1205, and a wave 3 from 1243 to 1168. The arithmetic is as follows: |
| Wave 1: 1243 - 1205 = 38 38 x 1.618 = 61.5 1205 - 61.5 = 1143.50 Wave 3: 1243 - 1168 = 75 75 x 0.618 = 46.4 1168 - 46.4 = 1121.60 (1143.50 + 1121.60)/2 = 1132.55 Thus, wave 1 and 3 are projecting a wave 5 low somewhere between 1143.50 and 1121.60, with 1132.55 being a sort of "ideal" number. Remember that these waves are the five smaller waves within the wave [iii] that has yet to be completed. So what is a wave 5 bottom for these smaller waves is a wave [iii] 1 degree higher. So the as-yet-to-be-discovered wave [iii] low is currently anticipated to be somewhere between 1143.50 and 1121.60 also. Remember also that wave [i] projected a wave [v] low at 1128.20--at the highest. These projections--especially those based on the smaller waves--are subject to change if it turns out that any of the wave counts are inaccurate. However, I do think that the wave counts and projections are a sound foundation for further exploration for those looking to apply Elliott wave methodology to the S&P 500's recent moves. |
Technical Writer for Technical Analysis of STOCKS & COMMODITIES magazine, Working-Money.com, and Traders.com Advantage.
| Title: | Technical Writer |
| Company: | Technical Analysis, Inc. |
| Address: | 4757 California Avenue SW |
| Seattle, WA 98116 | |
| Phone # for sales: | 206 938 0570 |
| Fax: | 206 938 1307 |
| Website: | www.Traders.com |
| E-mail address: | DPenn@traders.com |
Traders' Resource Links | |
| Charting the Stock Market: The Wyckoff Method -- Books | |
| Working-Money.com -- Online Trading Services | |
| Traders.com Advantage -- Online Trading Services | |
| Technical Analysis of Stocks & Commodities -- Publications and Newsletters | |
| Working Money, at Working-Money.com -- Publications and Newsletters | |
| Traders.com Advantage -- Publications and Newsletters | |
| Professional Traders Starter Kit -- Software | |
Click here for more information about our publications!
Comments
Date: 10/21/05Rank: 2Comment:

Request Information From Our Sponsors
- VectorVest, Inc.
- Executive Premier Workshop
- One-Day Options Course
- OptionsPro
- Retirement Income Workshop
- Sure-Fire Trading Systems (VectorVest, Inc.)
- Trading as a Business Workshop
- VectorVest 7 EOD
- VectorVest 7 RealTime/IntraDay
- VectorVest AutoTester
- VectorVest Educational Services
- VectorVest OnLine
- VectorVest Options Analyzer
- VectorVest ProGraphics v6.0
- VectorVest ProTrader 7
- VectorVest RealTime Derby Tool
- VectorVest Simulator
- VectorVest Variator
- VectorVest Watchdog
- StockCharts.com, Inc.
- Candle Patterns
- Candlestick Charting Explained
- Intermarket Technical Analysis
- John Murphy on Chart Analysis
- John Murphy's Chart Pattern Recognition
- John Murphy's Market Message
- MurphyExplainsMarketAnalysis-Intermarket Analysis
- MurphyExplainsMarketAnalysis-Visual Analysis
- StockCharts.com
- Technical Analysis of the Financial Markets
- The Visual Investor
