HOT TOPICS LIST
- MACD
- Fibonacci
- RSI
- Gann
- ADXR
- Stochastics
- Volume
- Triangles
- Futures
- Cycles
- Volatility
- ZIGZAG
- MESA
- Retracement
- Aroon
INDICATORS LIST
LIST OF TOPICS
PRINT THIS ARTICLE
by David Penn
Too clever by half? The NASDAQ 100 tracking stock finds support halfway between where the rally began in the spring and where it ended in the autumn.
Position: N/A
David Penn
Technical Writer for Technical Analysis of STOCKS & COMMODITIES magazine, Working-Money.com, and Traders.com Advantage.
PRINT THIS ARTICLE
RETRACEMENT
The QQQQ's 50% Solution
10/18/05 03:26:36 PMby David Penn
Too clever by half? The NASDAQ 100 tracking stock finds support halfway between where the rally began in the spring and where it ended in the autumn.
Position: N/A
| Halfway home--or halfway back to where it once belonged? Of all the retracement levels--Fibonacci standbys like the 61.8% and 38.2% levels, and more esoteric ones like 23.6% and 78.6%--the 50% retracement level is probably the most overlooked, at least considering how often the 50% retracement level appears on price charts as a meaningful place for support or resistance. Writing about the 50% retracement level in his book, The Visual Investor, author and trader John Murphy observes that: |
|

|
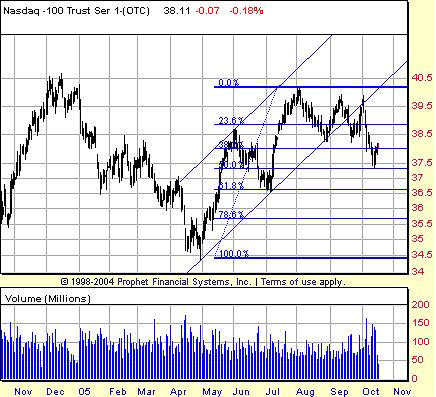
| FIGURE 1: QQQQ. Breaking out of its trend channel in late September, the QQQQ slips into a correction that retraces fully 50% of its advance from late April. |
| Graphic provided by: Prophet Financial, Inc. |
| |
Although many contemporary market technicians appear to pay relatively little attention to the 50% retracement level, the "halfway" correction has a respectable pedigree, including prominent placement in the Dow theorizing of analysts such as Richard Russell. Russell observed that when an index corrects less than 50% of its previous advance, the likelihood that the advancing trend will reassert itself is great. As he wrote in a newsletter piece a few years ago:
At any rate, what a major average does (I use the Dow) at the 50% or halfway level of a major advance or decline is critically important. Example: on a decline it's important to note whether the Dow halts above the halfway level of the preceding advance. If, on a decline, the Dow can retain 50% of the ground gained on the preceding advance, that's a bullish situation, and often leads to a test of the highs again. On the other hand, if the decline wipes out more than half of the preceding advance, that's a bearish situation and the Dow will usually go a good deal lower. |
| There are a few caveats inserted here: "major average," "major advance or decline" and so on. But the value placed on the 50% level is clear and, perhaps, applicable to the NASDAQ 100 and its rally from the spring lows, whether or not the NASDAQ 100 is considered a "major average" or its multimonth advance a "major advance." What we see in Figure 1 is a market that has retraced 50% of its previous rally and is in the process of bouncing from support at that level. Support based on previous price action does not seem to be the case. That support might have existed at the 38 level (the minor mid-June highs), and it might exist closer to 36.5 (the June lows). But the only argument for support at 37.5 is the fact that 37.5 is a 50% retracement level. |
| Because this is the QQQQ's first trip to the 50% retracement level, the bounce it gets will be key. If the bounce comes on low volume, then it is likely to fail and send the QQQQ down through the 50% retracement level. Volume has not been light in October, though it does appear as if each day of the bounce is receiving lighter volume than the last. That, coupled with the possibility of resistance near the August and September lows (approximately 38.25), suggests that the NASDAQ 100 might have its work cut out for it in terms of turning a mid-October bounce into a end-of-the-year bull market. |
Technical Writer for Technical Analysis of STOCKS & COMMODITIES magazine, Working-Money.com, and Traders.com Advantage.
| Title: | Technical Writer |
| Company: | Technical Analysis, Inc. |
| Address: | 4757 California Avenue SW |
| Seattle, WA 98116 | |
| Phone # for sales: | 206 938 0570 |
| Fax: | 206 938 1307 |
| Website: | www.Traders.com |
| E-mail address: | DPenn@traders.com |
Traders' Resource Links | |
| Charting the Stock Market: The Wyckoff Method -- Books | |
| Working-Money.com -- Online Trading Services | |
| Traders.com Advantage -- Online Trading Services | |
| Technical Analysis of Stocks & Commodities -- Publications and Newsletters | |
| Working Money, at Working-Money.com -- Publications and Newsletters | |
| Traders.com Advantage -- Publications and Newsletters | |
| Professional Traders Starter Kit -- Software | |
Click here for more information about our publications!
Comments
Date: 10/21/05Rank: 3Comment:

Request Information From Our Sponsors
- StockCharts.com, Inc.
- Candle Patterns
- Candlestick Charting Explained
- Intermarket Technical Analysis
- John Murphy on Chart Analysis
- John Murphy's Chart Pattern Recognition
- John Murphy's Market Message
- MurphyExplainsMarketAnalysis-Intermarket Analysis
- MurphyExplainsMarketAnalysis-Visual Analysis
- StockCharts.com
- Technical Analysis of the Financial Markets
- The Visual Investor
- VectorVest, Inc.
- Executive Premier Workshop
- One-Day Options Course
- OptionsPro
- Retirement Income Workshop
- Sure-Fire Trading Systems (VectorVest, Inc.)
- Trading as a Business Workshop
- VectorVest 7 EOD
- VectorVest 7 RealTime/IntraDay
- VectorVest AutoTester
- VectorVest Educational Services
- VectorVest OnLine
- VectorVest Options Analyzer
- VectorVest ProGraphics v6.0
- VectorVest ProTrader 7
- VectorVest RealTime Derby Tool
- VectorVest Simulator
- VectorVest Variator
- VectorVest Watchdog
