HOT TOPICS LIST
- MACD
- Fibonacci
- RSI
- Gann
- ADXR
- Stochastics
- Volume
- Triangles
- Futures
- Cycles
- Volatility
- ZIGZAG
- MESA
- Retracement
- Aroon
INDICATORS LIST
LIST OF TOPICS
PRINT THIS ARTICLE
by Paolo Pezzutti
Jeff Cooper's "Hit and Run" methodology profits from a pause in the original trend.
Position: N/A
Paolo Pezzutti
Author of the book "Trading the US Markets - A Comprehensive Guide to US Markets for International Traders and Investors" - Harriman House (July 2008)
PRINT THIS ARTICLE
TECHNICAL INDICATORS
Extended Level Boomers Setup For GM
10/17/05 08:41:42 AMby Paolo Pezzutti
Jeff Cooper's "Hit and Run" methodology profits from a pause in the original trend.
Position: N/A
| The concept behind the setup is that strongly trending markets pull back for a few days and then resume their trends. A runaway market will take a few days' rest before continuing on its way, especially in the early stages of the move. The pause can be in the form of sideways movement or a few down days. This happens because traders/investors who bought at lower prices and have a short-term approach to the market decide to lock in their profits. Momentum traders/investors use the pullback to continue to accumulate their positions at lower levels, once again causing prices to move higher and generate more momentum (the opposite is true for downtrending markets). It is impossible to predict how far the movement will go. The key is to climb aboard the train as early as possible and go with it. |
| Jeff Cooper's extended level boomers thrives on a pause in a trending market in the form of multiple inside days that follow new highs or new lows. After the expansion, there is a contraction that could anticipate the original trend resumption. The rules suggested by Cooper's in his famous book Hit And Run II are: - You have a new 60-day high on day 1. - The next two days and beyond the stock prints inside days with reference to the day 1 high. - Following the two inside days, place a buy-stop one tick above the day 1 high. - If the stock trades below the day 1 low, cancel the order. - When filled, use a trailing stop to lock in profits. The opposite rules are true in a downtrending market. |
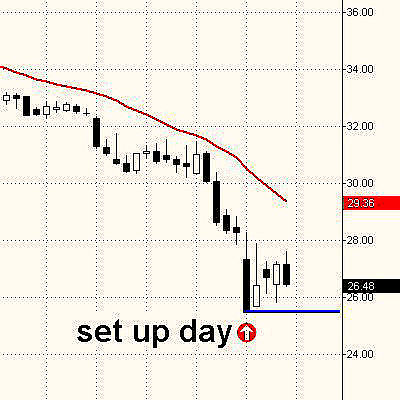
| In Figure 1, General Motors (GM) displayed this setup last week: - The stock is in a strong downtrend and prints a 60-day low (day 1). - Following the expansion day, you have four inside days. These days have their highs below day 1's high and their low above day 1's low. After two inside days, you could try and place a short sell-stop order one tick below the day 1 low. Until last Friday's session, you would not have been filled. The setup, then, is still valid for next week's trading sessions. |

|
| FIGURE 1: GM. General Motors prints a short-sell setup for this week. |
| Graphic provided by: TradeStation. |
| |
| If you have a breakout to the downside, the trade is based on the possibility that other expansions will follow in the direction of the original trend. The trend is strong, and so far there are no signs of trend change. Note that there are countertrend short-term setups that capitalize on the failure of these breakout patterns--for example, Linda Raschke and Larry Connors' Turtle Soup and Turtle Soup Plus One. It is up to you to decide which types of methodologies fit to your personality and trading style. The key is that, similar to other short-term setups, it is necessary to apply clear stop-loss and money management rules. The risk has to be kept low while, as we trade a breakout pattern, the rewards should often be high. |
Author of the book "Trading the US Markets - A Comprehensive Guide to US Markets for International Traders and Investors" - Harriman House (July 2008)
| Address: | VIA ROBERTO AGO 26 POSTAL CODE 00166 |
| Rome, ITALY | |
| Phone # for sales: | +393357540708 |
| E-mail address: | pezzutti.paolo@tiscali.it |
Click here for more information about our publications!
Comments
Date: 10/21/05Rank: 3Comment:

Request Information From Our Sponsors
- VectorVest, Inc.
- Executive Premier Workshop
- One-Day Options Course
- OptionsPro
- Retirement Income Workshop
- Sure-Fire Trading Systems (VectorVest, Inc.)
- Trading as a Business Workshop
- VectorVest 7 EOD
- VectorVest 7 RealTime/IntraDay
- VectorVest AutoTester
- VectorVest Educational Services
- VectorVest OnLine
- VectorVest Options Analyzer
- VectorVest ProGraphics v6.0
- VectorVest ProTrader 7
- VectorVest RealTime Derby Tool
- VectorVest Simulator
- VectorVest Variator
- VectorVest Watchdog
- StockCharts.com, Inc.
- Candle Patterns
- Candlestick Charting Explained
- Intermarket Technical Analysis
- John Murphy on Chart Analysis
- John Murphy's Chart Pattern Recognition
- John Murphy's Market Message
- MurphyExplainsMarketAnalysis-Intermarket Analysis
- MurphyExplainsMarketAnalysis-Visual Analysis
- StockCharts.com
- Technical Analysis of the Financial Markets
- The Visual Investor
