HOT TOPICS LIST
- MACD
- Fibonacci
- RSI
- Gann
- ADXR
- Stochastics
- Volume
- Triangles
- Futures
- Cycles
- Volatility
- ZIGZAG
- MESA
- Retracement
- Aroon
INDICATORS LIST
LIST OF TOPICS
PRINT THIS ARTICLE
by David Penn
A head & shoulders top appears to be a bearish work in progress over the Banking Index.
Position: N/A
David Penn
Technical Writer for Technical Analysis of STOCKS & COMMODITIES magazine, Working-Money.com, and Traders.com Advantage.
PRINT THIS ARTICLE
HEAD & SHOULDERS
A Big Bad Banking Top
10/13/05 07:43:57 AMby David Penn
A head & shoulders top appears to be a bearish work in progress over the Banking Index.
Position: N/A
| Take a good look, investors of the 21st century, at the first bull market of the new millennium. |
| During the 1990s, even as technology soared, the cognoscenti in financial circles always insisted that it was the financials whose performance would let investors know the true health of the market. This was a pretty clear admission that the US economy (and, to some degree by extension, the world economy) was no longer driven by industry and was in fact wholly wedded to the fortunes of finance. |

|
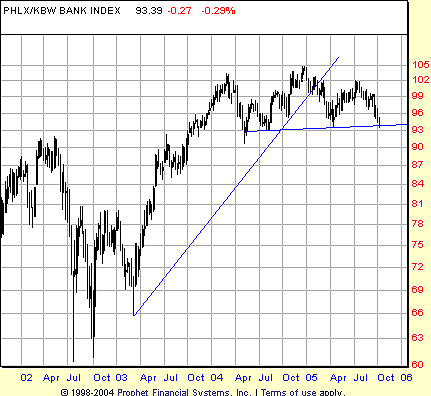
| FIGURE 1: BANKING INDEX. A trendline break in the first quarter of 2005 and a head & shoulders top that began back in the first quarter of 2004 are the two dominant technical features in this long-term portrait of the Banking Index. |
| Graphic provided by: Prophet Financial, Inc. |
| |
| Of late, those fortunes have taken a turn for the worse. Looking at the multiyear, weekly chart of the Philadelphia Banking Index in Figure 1, there are two technical features that stand out. The first is the violation of the trendline that marked the cyclical bull market in both the Banking Index as well as the broader stock market. This trendline was broken in the first quarter of 2005. Interestingly, the break of the trendline also reveals the Banking Index to have been underperforming the broader market. Compared to the Standard & Poor's 500, for example, which topped late in the second quarter of 2005, the Banking Index now appears to have topped in the fourth quarter of 2004. If the truism about the relationship between the financial sector and the economy holds, then the fact that banking stocks have clearly underperformed is a bearish sign for the market and the economy in general. |
| The other major technical feature of the Banking Index is the developing head & shoulders top. This head & shoulders top has its origins in the fourth quarter of 2003 and appears to be on the verge of a breakdown just as the fourth quarter of 2005 begins. The trendline mentioned actually slices the "head" part of the head & shoulders top in half, with the left shoulder lasting from fourth-quarter 2004 to second-quarter 2005 and the right shoulder -- apparently -- lasting from second-quarter 2005 to fourth-quarter 2005. |
| Should this head & shoulders top prove valid, the size of the pattern suggests significant correction. In this context, validity most likely would come in the form of a decisive move below the neckline at 93. With a pattern high of 105 and, thus, a formation size of about 12 points, a minimum move down to 81 is what traders should look for in the event of a breakdown. The 81 area, should the Banking Index reach it, might provide significant support insofar as there is old resistance at that level that was left over from the triple bottom of the autumn of 2002 and the spring of 2003. |
Technical Writer for Technical Analysis of STOCKS & COMMODITIES magazine, Working-Money.com, and Traders.com Advantage.
| Title: | Technical Writer |
| Company: | Technical Analysis, Inc. |
| Address: | 4757 California Avenue SW |
| Seattle, WA 98116 | |
| Phone # for sales: | 206 938 0570 |
| Fax: | 206 938 1307 |
| Website: | www.Traders.com |
| E-mail address: | DPenn@traders.com |
Traders' Resource Links | |
| Charting the Stock Market: The Wyckoff Method -- Books | |
| Working-Money.com -- Online Trading Services | |
| Traders.com Advantage -- Online Trading Services | |
| Technical Analysis of Stocks & Commodities -- Publications and Newsletters | |
| Working Money, at Working-Money.com -- Publications and Newsletters | |
| Traders.com Advantage -- Publications and Newsletters | |
| Professional Traders Starter Kit -- Software | |
Click here for more information about our publications!
Comments
Date: 10/13/05Rank: 4Comment:
Date: 10/21/05Rank: 4Comment:

Request Information From Our Sponsors
- VectorVest, Inc.
- Executive Premier Workshop
- One-Day Options Course
- OptionsPro
- Retirement Income Workshop
- Sure-Fire Trading Systems (VectorVest, Inc.)
- Trading as a Business Workshop
- VectorVest 7 EOD
- VectorVest 7 RealTime/IntraDay
- VectorVest AutoTester
- VectorVest Educational Services
- VectorVest OnLine
- VectorVest Options Analyzer
- VectorVest ProGraphics v6.0
- VectorVest ProTrader 7
- VectorVest RealTime Derby Tool
- VectorVest Simulator
- VectorVest Variator
- VectorVest Watchdog
- StockCharts.com, Inc.
- Candle Patterns
- Candlestick Charting Explained
- Intermarket Technical Analysis
- John Murphy on Chart Analysis
- John Murphy's Chart Pattern Recognition
- John Murphy's Market Message
- MurphyExplainsMarketAnalysis-Intermarket Analysis
- MurphyExplainsMarketAnalysis-Visual Analysis
- StockCharts.com
- Technical Analysis of the Financial Markets
- The Visual Investor
