HOT TOPICS LIST
- MACD
- Fibonacci
- RSI
- Gann
- ADXR
- Stochastics
- Volume
- Triangles
- Futures
- Cycles
- Volatility
- ZIGZAG
- MESA
- Retracement
- Aroon
INDICATORS LIST
LIST OF TOPICS
PRINT THIS ARTICLE
by Arthur Hill
United Technologies has been in a holding pattern this year, but the pattern is looking bearish and momentum is breaking down.
Position: Hold
Arthur Hill
Arthur Hill is currently editor of TDTrader.com, a website specializing in trading strategies, sector/industry specific breadth stats and overall technical analysis. He passed the Society of Technical Analysts (STA London) diploma exam with distinction is a Certified Financial Technician (CFTe). Prior to TD Trader, he was the Chief Technical Analyst for Stockcharts.com and the main contributor to the ChartSchool.
PRINT THIS ARTICLE
CONSOLID FORMATION
United Tech Forms A Large Diamond
10/12/05 08:05:06 AMby Arthur Hill
United Technologies has been in a holding pattern this year, but the pattern is looking bearish and momentum is breaking down.
Position: Hold
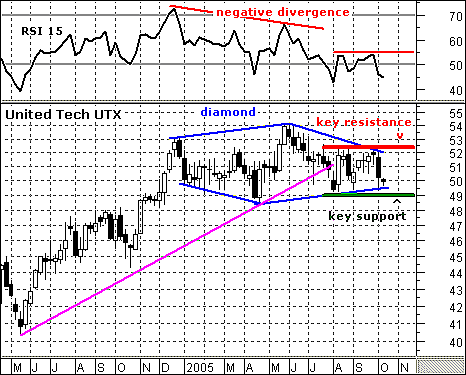
| On the weekly chart (Figure 1), United Technologies (UTX) formed a massive diamond that extends back to December 2004. The left half looks like a broadening formation and the right half looks like a triangle. Together, these amount to one large consolidation that is dependent on a break to establish direction. |

|
| FIGURE 1: UTX. United Technologies has formed a large diamond extending back to December 2004. |
| Graphic provided by: MetaStock. |
| Graphic provided by: MS QuoteCenter. |
| |
| A move above 52.5 would be bullish and a break below 49 would be bearish. Key resistance is set at 52.5 and it would take a move above this level to clear the upper diamond trendline and August/September highs. Key support is set at 49 and it would take a move below this level to break the lower diamond trendline and the August/September lows. Basically, the resolution of a four-month trading range (49-52.5) will decide the fate of this key Dow component. |
| The relative strength index (RSI) is signaling that the break will be to the downside. While anticipating support breaks can be a dangerous game, it can improve the risk-reward ratio and limit risk. RSI formed a large negative divergence from December 2004 to May 2005 and moved below 50 in early August. The indicator firmed around 50, but the damage had already been done and it would take a move above resistance at 55 for momentum to recover. |
Arthur Hill is currently editor of TDTrader.com, a website specializing in trading strategies, sector/industry specific breadth stats and overall technical analysis. He passed the Society of Technical Analysts (STA London) diploma exam with distinction is a Certified Financial Technician (CFTe). Prior to TD Trader, he was the Chief Technical Analyst for Stockcharts.com and the main contributor to the ChartSchool.
| Title: | Editor |
| Company: | TDTrader.com |
| Address: | Willem Geetsstraat 17 |
| Mechelen, B2800 | |
| Phone # for sales: | 3215345465 |
| Website: | www.tdtrader.com |
| E-mail address: | arthurh@tdtrader.com |
Traders' Resource Links | |
| TDTrader.com has not added any product or service information to TRADERS' RESOURCE. | |
Click here for more information about our publications!
Comments
Date: 10/12/05Rank: 4Comment:
Date: 10/21/05Rank: 4Comment:

|

Request Information From Our Sponsors
- StockCharts.com, Inc.
- Candle Patterns
- Candlestick Charting Explained
- Intermarket Technical Analysis
- John Murphy on Chart Analysis
- John Murphy's Chart Pattern Recognition
- John Murphy's Market Message
- MurphyExplainsMarketAnalysis-Intermarket Analysis
- MurphyExplainsMarketAnalysis-Visual Analysis
- StockCharts.com
- Technical Analysis of the Financial Markets
- The Visual Investor
- VectorVest, Inc.
- Executive Premier Workshop
- One-Day Options Course
- OptionsPro
- Retirement Income Workshop
- Sure-Fire Trading Systems (VectorVest, Inc.)
- Trading as a Business Workshop
- VectorVest 7 EOD
- VectorVest 7 RealTime/IntraDay
- VectorVest AutoTester
- VectorVest Educational Services
- VectorVest OnLine
- VectorVest Options Analyzer
- VectorVest ProGraphics v6.0
- VectorVest ProTrader 7
- VectorVest RealTime Derby Tool
- VectorVest Simulator
- VectorVest Variator
- VectorVest Watchdog
