HOT TOPICS LIST
- MACD
- Fibonacci
- RSI
- Gann
- ADXR
- Stochastics
- Volume
- Triangles
- Futures
- Cycles
- Volatility
- ZIGZAG
- MESA
- Retracement
- Aroon
INDICATORS LIST
LIST OF TOPICS
PRINT THIS ARTICLE
by David Penn
Using Fibonacci to gauge pullbacks in the USD/JPY.
Position: N/A
David Penn
Technical Writer for Technical Analysis of STOCKS & COMMODITIES magazine, Working-Money.com, and Traders.com Advantage.
PRINT THIS ARTICLE
FIBONACCI
Retracing Yen
10/12/05 07:55:12 AMby David Penn
Using Fibonacci to gauge pullbacks in the USD/JPY.
Position: N/A
| Last night, I found myself eyeballing the USD/JPY. A powerful move to the upside had begun in the hourly charts in recent days, and I was looking for opportunities to get long. At the time I began watching USD/JPY, it had already broken out above the 114 level to 114.31, and had begun to shrink back slightly. |
| The question for any buyer when it comes to pullbacks is straightforward: How far "back" does the asset need to "pull" before it is buyable? For some traders, particularly those with a more conservative approach to trading, the solution--as opposed to the answer--to this question is no less straightforward: You wait until the previous high is exceeded by a tick or two. But those with a somewhat more aggressive attitude will want to buy the asset as low into its pullback as possible. |

|
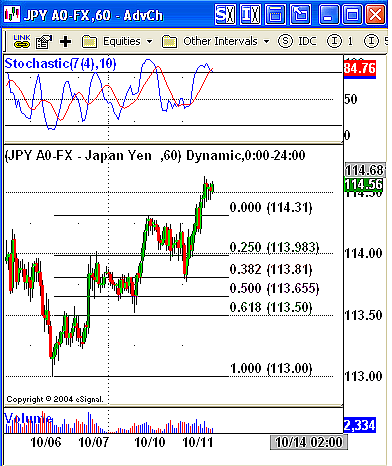
| FIGURE 1: USD/JPY. After stalling temporarily at 114.31, the USD/JPY retraced back to the 38.2% Fibonacci retracement level before vaulting higher. |
| Graphic provided by: eSignal. |
| |
| My first thought in terms of likely support at USD/JPY moved down from 114.31 was the breakout high back near ... well, where exactly? Was the breakout down at the 114 level (Figure 1)? Or was it even lower at the 113.85/90 level? Some traders consistently disregard the long tails or shadows on candlesticks. I tend to think this is a mistake unless your trading approach is only concerned with closing prices. If you are willing to let an individual bar or candlestick run for as far as it likes, only concerning yourself with where it closes, then so be it. However, if you use stops that aren't closing-price based, it seems to me that every print is important, and long shadows and tails on candlesticks--at least up to a point--need to be taken seriously. |
| Fortunately in this case, traders don't have to quibble over where the proper breakout level was in the USD/JPY. Instead, they can rely on Fibonacci retracements to gauge likely levels where the post-114.31 pullback might be likely to find support. While the minimum pullback is usually thought to be 25% or 0.25, a pullback to the 38.2% or 0.382 level is generally considered to be a typical pullback in a healthy advance. A pullback to that level is a little more than a third retracement, and often that much of a retracement is enough to take some of the steam out of the trend, allowing some (weaker) traders to get out of positions and others to get in. As John Murphy wrote in his book, The Visual Investor: |
As Figure 1 shows, the 38.2% retracement level proved to be an excellent level for a short-term bull to establish a long position, as the USD/JPY pulled back to an hourly low of 113.77--a mere four pips below the 38.2% retracement level--before moving sharply and swiftly higher over the next several hours. |
Technical Writer for Technical Analysis of STOCKS & COMMODITIES magazine, Working-Money.com, and Traders.com Advantage.
| Title: | Technical Writer |
| Company: | Technical Analysis, Inc. |
| Address: | 4757 California Avenue SW |
| Seattle, WA 98116 | |
| Phone # for sales: | 206 938 0570 |
| Fax: | 206 938 1307 |
| Website: | www.Traders.com |
| E-mail address: | DPenn@traders.com |
Traders' Resource Links | |
| Charting the Stock Market: The Wyckoff Method -- Books | |
| Working-Money.com -- Online Trading Services | |
| Traders.com Advantage -- Online Trading Services | |
| Technical Analysis of Stocks & Commodities -- Publications and Newsletters | |
| Working Money, at Working-Money.com -- Publications and Newsletters | |
| Traders.com Advantage -- Publications and Newsletters | |
| Professional Traders Starter Kit -- Software | |
Click here for more information about our publications!
Comments
Date: 10/12/05Rank: 4Comment:
Date: 10/21/05Rank: 4Comment:

Request Information From Our Sponsors
- StockCharts.com, Inc.
- Candle Patterns
- Candlestick Charting Explained
- Intermarket Technical Analysis
- John Murphy on Chart Analysis
- John Murphy's Chart Pattern Recognition
- John Murphy's Market Message
- MurphyExplainsMarketAnalysis-Intermarket Analysis
- MurphyExplainsMarketAnalysis-Visual Analysis
- StockCharts.com
- Technical Analysis of the Financial Markets
- The Visual Investor
- VectorVest, Inc.
- Executive Premier Workshop
- One-Day Options Course
- OptionsPro
- Retirement Income Workshop
- Sure-Fire Trading Systems (VectorVest, Inc.)
- Trading as a Business Workshop
- VectorVest 7 EOD
- VectorVest 7 RealTime/IntraDay
- VectorVest AutoTester
- VectorVest Educational Services
- VectorVest OnLine
- VectorVest Options Analyzer
- VectorVest ProGraphics v6.0
- VectorVest ProTrader 7
- VectorVest RealTime Derby Tool
- VectorVest Simulator
- VectorVest Variator
- VectorVest Watchdog
