

HOT TOPICS LIST
- MACD
- Fibonacci
- RSI
- Gann
- ADXR
- Stochastics
- Volume
- Triangles
- Futures
- Cycles
- Volatility
- ZIGZAG
- MESA
- Retracement
- Aroon
INDICATORS LIST
LIST OF TOPICS
PRINT THIS ARTICLE
by Koos van der Merwe
With oil prices this high scaring us away from the gas pumps, what's next on the cards?
Position: Sell
Koos van der Merwe
Has been a technical analyst since 1969, and has worked as a futures and options trader with First Financial Futures in Johannesburg, South Africa.
PRINT THIS ARTICLE
ELLIOTT WAVE
What's Next For The World's Energy?
10/11/05 02:04:21 PMby Koos van der Merwe
With oil prices this high scaring us away from the gas pumps, what's next on the cards?
Position: Sell
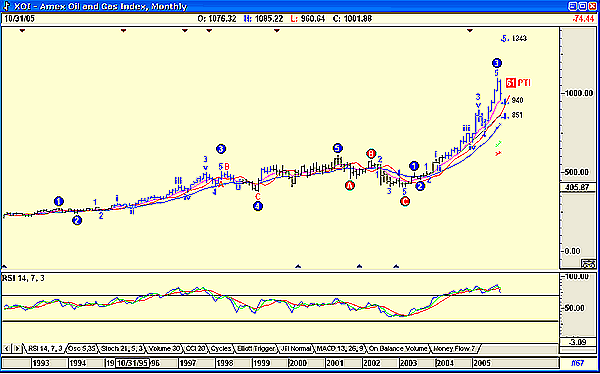
| Figure 1 is a monthly chart of Amex Oil and Gas. The Advanced GET program automatically calculates a wave count, and the calculation for the chart suggests that the market is looking for still-higher prices in the coming months. But first, a fourth-wave bottom has to develop at either 940 or 951. Of course, these price forecasts are not cast in stone, but they do give a suggestion of where prices could go. The chart also suggests that once the fourth wave is complete, the index could look for a fifth-wave high of about 1343, with a 61% probablility (PTI) of reaching this target. The question is when will this happen, and with the relative strength index (RSI) at oversold levels, it could be a year or two. To try and fine-tune the forecast, let us have a look at the weekly chart (Figure 2). |
|
| FIGURE 1: AMEX OIL AND GAS MONTHLY CHART. This chart suggests that once the fourth wave is complete, the index could look for a fifth-wave high of about 1343. |
| Graphic provided by: AdvancedGET. |
| |
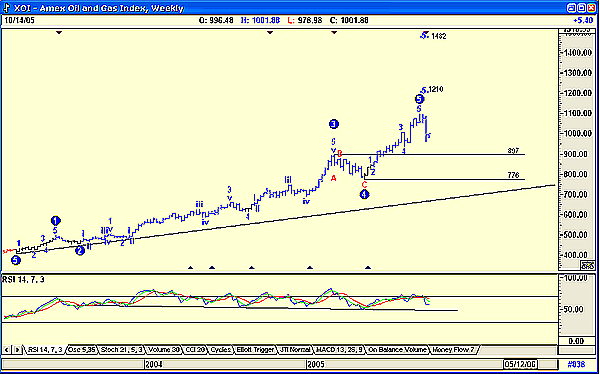
| The weekly chart confirms the five-wave count and suggests that a fifth wave has already formed. After a wave 5 comes an ABC retracement, and this suggests that the fourth wave of the monthly chart is not yet complete. The chart is also suggesting that the index could rise to the 1210 or 1482 level sometime in the future. However, the chart is also suggesting that if the fifth wave is complete, we could see a fall to somewhere between the 776 and 897 level. The RSI is suggesting the downside is more probable than the upside. To answer this question, we must look at the daily chart. |
|
| FIGURE 2: AMEX OIL AND GAS WEEKLY CHART. The chart is suggesting that if the fifth wave is complete, we could see a fall to somewhere between the 776 and 897 level. |
| Graphic provided by: AdvancedGET. |
| |
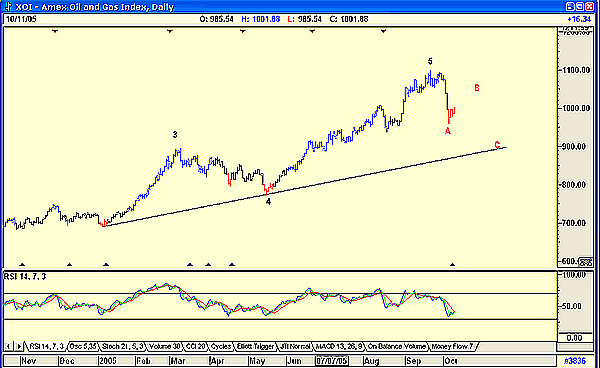
| The daily chart (Figure 3) is suggesting that a bottom is close at hand. This means that the fourth wave of the monthly and weekly charts is bottoming, which means that we could see prices of oil and gas rising even higher and sooner than originally estimated. |
|
| FIGURE 3: AMEX OIL AND GAS DAILY CHART. The trend is now up in a B-wave. |
| Graphic provided by: AdvancedGET. |
| |
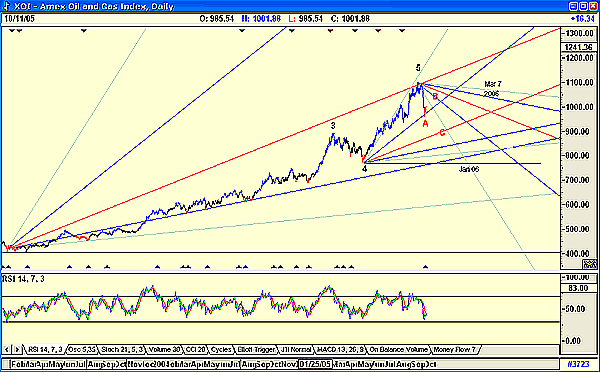
| Finally, let us look at time. For this projection I use the Gann fan (Figure 4), drawn from a major pivot point. Where the fan crosses a horizontal drawn from a previous major pivot point, we will find a possible turning point. The next date is January 11, 2006, so it is possible that the index could fall till that date. At the very least, we know two things: 1. The market believes the oil price could rise to new highs. 2. The date for a possible low could be January 11, 2006. |
|
| FIGURE 4: AMEX OIL AND GAS, GANN FAN. We know two things: first, the market believes that the oil price could rise to new highs. And second, the date for a possible low could be January 11, 2006. |
| Graphic provided by: AdvancedGET. |
| |
| Let us see what happens, and at the very least, BE PREPARED! |
Has been a technical analyst since 1969, and has worked as a futures and options trader with First Financial Futures in Johannesburg, South Africa.
| Address: | 3256 West 24th Ave |
| Vancouver, BC | |
| Phone # for sales: | 6042634214 |
| E-mail address: | petroosp@gmail.com |
Click here for more information about our publications!
Comments
Date:�10/11/05Rank:�3Comment:�
Date:�10/12/05Rank:�5Comment:�
Date:�10/21/05Rank:�2Comment:�

Request Information From Our Sponsors
- StockCharts.com, Inc.
- Candle Patterns
- Candlestick Charting Explained
- Intermarket Technical Analysis
- John Murphy on Chart Analysis
- John Murphy's Chart Pattern Recognition
- John Murphy's Market Message
- MurphyExplainsMarketAnalysis-Intermarket Analysis
- MurphyExplainsMarketAnalysis-Visual Analysis
- StockCharts.com
- Technical Analysis of the Financial Markets
- The Visual Investor
- VectorVest, Inc.
- Executive Premier Workshop
- One-Day Options Course
- OptionsPro
- Retirement Income Workshop
- Sure-Fire Trading Systems (VectorVest, Inc.)
- Trading as a Business Workshop
- VectorVest 7 EOD
- VectorVest 7 RealTime/IntraDay
- VectorVest AutoTester
- VectorVest Educational Services
- VectorVest OnLine
- VectorVest Options Analyzer
- VectorVest ProGraphics v6.0
- VectorVest ProTrader 7
- VectorVest RealTime Derby Tool
- VectorVest Simulator
- VectorVest Variator
- VectorVest Watchdog