HOT TOPICS LIST
- MACD
- Fibonacci
- RSI
- Gann
- ADXR
- Stochastics
- Volume
- Triangles
- Futures
- Cycles
- Volatility
- ZIGZAG
- MESA
- Retracement
- Aroon
INDICATORS LIST
LIST OF TOPICS
PRINT THIS ARTICLE
by Arthur Hill
The NYSE Composite moved to new highs in September, but not as many stocks participated as before -- not a good omen.
Position: Hold
Arthur Hill
Arthur Hill is currently editor of TDTrader.com, a website specializing in trading strategies, sector/industry specific breadth stats and overall technical analysis. He passed the Society of Technical Analysts (STA London) diploma exam with distinction is a Certified Financial Technician (CFTe). Prior to TD Trader, he was the Chief Technical Analyst for Stockcharts.com and the main contributor to the ChartSchool.
PRINT THIS ARTICLE
BREADTH THRUST
Participation On The NYSE Narrows
10/11/05 07:32:46 AMby Arthur Hill
The NYSE Composite moved to new highs in September, but not as many stocks participated as before -- not a good omen.
Position: Hold
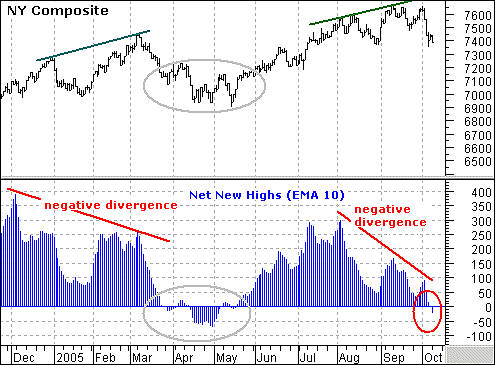
| This breadth indicator shows the 10-day exponential moving average (EMA) for net new highs on the NYSE (52-week highs less 52-week lows) (Figure 1). It is a measure of breadth that reflects broad market participation. In general, readings above +200 show broad strength and good breadth. Readings below -200 show broad weakness and bad breadth. It is important for breadth to keep pace with the underlying index. Failure to keep pace shows underlying weakness that could come back to haunt the index. |

|
| FIGURE 1: NEGATIVE DIVERGENCES. There have been two negative divergences in a year -- the first occurred from December to March, and the second from August to September. |
| Graphic provided by: MetaStock. |
| Graphic provided by: MS QuoteCenter. |
| |
| NYSE breadth continues to deteriorate as fewer stocks (new highs) participated in the August-September advance and more stocks participated in the October decline (new lows). The 10-day EMA for net new highs peaked around +300 in early August, but only reached +170 in mid-September. This produced a negative divergence as the NYSE Composite moved to a new high. As noted, this negative divergence shows underlying weakness in the rally and should be some cause for concern. |
| This is the second negative divergence in a year. The first negative divergence occurred from December 2004 to March 2005, and the second from August to September. The indicator turned negative in late March, and this led to weakness in the index until mid-May. The indicator turned negative again this month, which shows that new lows are outnumbering new highs. This is clearly a sign of weakness, not strength. |
Arthur Hill is currently editor of TDTrader.com, a website specializing in trading strategies, sector/industry specific breadth stats and overall technical analysis. He passed the Society of Technical Analysts (STA London) diploma exam with distinction is a Certified Financial Technician (CFTe). Prior to TD Trader, he was the Chief Technical Analyst for Stockcharts.com and the main contributor to the ChartSchool.
| Title: | Editor |
| Company: | TDTrader.com |
| Address: | Willem Geetsstraat 17 |
| Mechelen, B2800 | |
| Phone # for sales: | 3215345465 |
| Website: | www.tdtrader.com |
| E-mail address: | arthurh@tdtrader.com |
Traders' Resource Links | |
| TDTrader.com has not added any product or service information to TRADERS' RESOURCE. | |
Click here for more information about our publications!
Comments
Date: 10/11/05Rank: 4Comment:
Date: 10/12/05Rank: 5Comment:
Date: 10/21/05Rank: 4Comment:

Request Information From Our Sponsors
- VectorVest, Inc.
- Executive Premier Workshop
- One-Day Options Course
- OptionsPro
- Retirement Income Workshop
- Sure-Fire Trading Systems (VectorVest, Inc.)
- Trading as a Business Workshop
- VectorVest 7 EOD
- VectorVest 7 RealTime/IntraDay
- VectorVest AutoTester
- VectorVest Educational Services
- VectorVest OnLine
- VectorVest Options Analyzer
- VectorVest ProGraphics v6.0
- VectorVest ProTrader 7
- VectorVest RealTime Derby Tool
- VectorVest Simulator
- VectorVest Variator
- VectorVest Watchdog
- StockCharts.com, Inc.
- Candle Patterns
- Candlestick Charting Explained
- Intermarket Technical Analysis
- John Murphy on Chart Analysis
- John Murphy's Chart Pattern Recognition
- John Murphy's Market Message
- MurphyExplainsMarketAnalysis-Intermarket Analysis
- MurphyExplainsMarketAnalysis-Visual Analysis
- StockCharts.com
- Technical Analysis of the Financial Markets
- The Visual Investor
