HOT TOPICS LIST
- MACD
- Fibonacci
- RSI
- Gann
- ADXR
- Stochastics
- Volume
- Triangles
- Futures
- Cycles
- Volatility
- ZIGZAG
- MESA
- Retracement
- Aroon
INDICATORS LIST
LIST OF TOPICS
PRINT THIS ARTICLE
by Arthur Hill
Weyerhaeuser has been underperforming the broader market and formed a bearish reversal pattern over the last 12 months.
Position: Hold
Arthur Hill
Arthur Hill is currently editor of TDTrader.com, a website specializing in trading strategies, sector/industry specific breadth stats and overall technical analysis. He passed the Society of Technical Analysts (STA London) diploma exam with distinction is a Certified Financial Technician (CFTe). Prior to TD Trader, he was the Chief Technical Analyst for Stockcharts.com and the main contributor to the ChartSchool.
PRINT THIS ARTICLE
HEAD & SHOULDERS
Weyerhaeuser Lagging
10/10/05 08:22:12 AMby Arthur Hill
Weyerhaeuser has been underperforming the broader market and formed a bearish reversal pattern over the last 12 months.
Position: Hold
| Relative performance often foreshadows absolute performance. Stocks that outperform the overall market are deemed healthy and more likely to rise. Stocks that underperform are unhealthy and more likely to fall. Everyone wants a winner and relative performance separates the winners from the losers. |

|
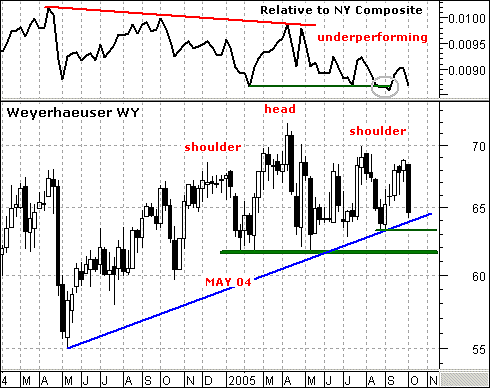
| FIGURE 1: WY. In this chart of Weyerhaeuser, we can see that a head-and-shoulders reversal has taken shape over the last 12 months. |
| Graphic provided by: MetaStock. |
| Graphic provided by: MS QuoteCenter. |
| |
| On Figure 1, we can see that the price relative is in a steady downtrend and moved to a 52-week low in September (gray oval). WY has been holding up relatively well on the price chart, but it is clear from the price relative that there were better gains to be had elsewhere. Relative weakness is a negative that could lead to absolute weakness. |
| A head-and-shoulders reversal has taken shape over the last 12 months. The left shoulder peaked in December 2004, the head in April 2005, and the right shoulder in July 2005. Neckline support is set at 61.77 and a break below this level would confirm the pattern. The downside projection would be to around 52. |
| It ain't broken until it's broken. As long as neckline support holds, the stock is technically flat with support around 62 and resistance at 70. Waiting for confirmation increases the chances of success. Those looking for an earlier signal can turn to the May 2004 trendline and August low (63.3). A break below these two would forge a lower low and increase the odds of a neckline break. |
Arthur Hill is currently editor of TDTrader.com, a website specializing in trading strategies, sector/industry specific breadth stats and overall technical analysis. He passed the Society of Technical Analysts (STA London) diploma exam with distinction is a Certified Financial Technician (CFTe). Prior to TD Trader, he was the Chief Technical Analyst for Stockcharts.com and the main contributor to the ChartSchool.
| Title: | Editor |
| Company: | TDTrader.com |
| Address: | Willem Geetsstraat 17 |
| Mechelen, B2800 | |
| Phone # for sales: | 3215345465 |
| Website: | www.tdtrader.com |
| E-mail address: | arthurh@tdtrader.com |
Traders' Resource Links | |
| TDTrader.com has not added any product or service information to TRADERS' RESOURCE. | |
Click here for more information about our publications!
Comments
Date: 10/10/05Rank: 4Comment:
Date: 10/21/05Rank: 4Comment:

Request Information From Our Sponsors
- StockCharts.com, Inc.
- Candle Patterns
- Candlestick Charting Explained
- Intermarket Technical Analysis
- John Murphy on Chart Analysis
- John Murphy's Chart Pattern Recognition
- John Murphy's Market Message
- MurphyExplainsMarketAnalysis-Intermarket Analysis
- MurphyExplainsMarketAnalysis-Visual Analysis
- StockCharts.com
- Technical Analysis of the Financial Markets
- The Visual Investor
- VectorVest, Inc.
- Executive Premier Workshop
- One-Day Options Course
- OptionsPro
- Retirement Income Workshop
- Sure-Fire Trading Systems (VectorVest, Inc.)
- Trading as a Business Workshop
- VectorVest 7 EOD
- VectorVest 7 RealTime/IntraDay
- VectorVest AutoTester
- VectorVest Educational Services
- VectorVest OnLine
- VectorVest Options Analyzer
- VectorVest ProGraphics v6.0
- VectorVest ProTrader 7
- VectorVest RealTime Derby Tool
- VectorVest Simulator
- VectorVest Variator
- VectorVest Watchdog
