HOT TOPICS LIST
- MACD
- Fibonacci
- RSI
- Gann
- ADXR
- Stochastics
- Volume
- Triangles
- Futures
- Cycles
- Volatility
- ZIGZAG
- MESA
- Retracement
- Aroon
INDICATORS LIST
LIST OF TOPICS
PRINT THIS ARTICLE
by Paolo Pezzutti
The stock has been in a downtrend during the past five years.
Position: N/A
Paolo Pezzutti
Author of the book "Trading the US Markets - A Comprehensive Guide to US Markets for International Traders and Investors" - Harriman House (July 2008)
PRINT THIS ARTICLE
BOLLINGER BANDS
Merck Shows A Positive Divergence Of The Bollinger %b Indicator
10/10/05 08:58:57 AMby Paolo Pezzutti
The stock has been in a downtrend during the past five years.
Position: N/A
| Merck (MRK), the well-known pharmaceutical company, hopes its new cervical cancer vaccine will provide a much-needed boost to earnings after the debacle of Vioxx, its pain-killing drug that was withdrawn from the market last year because of health risks. On Friday, October 7, MRK's defense in the second Vioxx lawsuit to reach trial sustained a serious blow when the New Jersey judge overseeing the case threw out testimony from the company's first witness and then shouted down a defense lawyer who tried to protest the decision. The news hit the market and prices plunged 3.65%. |
| To analyze the technical situation of MRK, I will use %b, an indicator derived from the Bollinger Bands that measures where the last price is in relation to the bands. The formula to build this indicator is: (Last - lowerband)/(Upperband - lowerband). %b can be used to tells us where we are within the bands. Unlike typical oscillators, which are bounded by zero and 100, %b can assume negative values and values above 100, when prices are outside of the bands. It is a relative tool, with no absolute information. The power of it is that you can calculate it not only on the price (typically the close), but also on other indicators. This feature provides you with the possibility to perform all sorts of relative comparisons. Appropriate indicators can be derived from momentum, volume, sentiment, open interest, intermarket data, and so forth. For example, you can compare the price action within the bands with the action of an indicator, such as a volume oscillator. Or you can use it in pattern recognition, for example to spot divergences with the price action. |

|
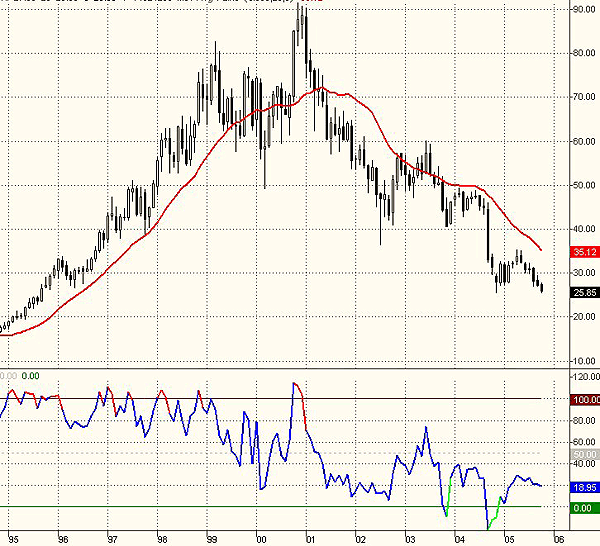
| FIGURE 1: MRK MONTHLY CHART. The stock's performance over the past 10 years shows a top of $90 at the end of 2000, with a steady decline in the last five. |
| Graphic provided by: TradeStation. |
| |
| In the monthly chart (Figure 1), you can see the stock's performance during the past 10 years. From about $19 in 1995, prices went up to a top of $90 at the end of 2000. The last five years have seen prices going down steadily to the present $25.85. The downtrend is strong. The indicator is calculated based on the closing price. Note the positive divergence in this time frame. |

|
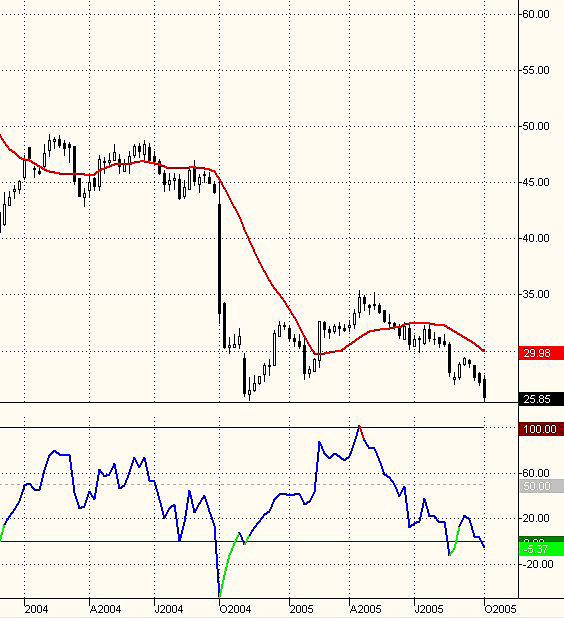
| FIGURE 2: MRK WEEKLY CHART. The Merck stock is testing the previous low. |
| Graphic provided by: TradeStation. |
| |
| Let's see the %b indications on MRK weekly chart (Figure 2). As you can see, the stock in October 2004 left a trading range in the $45 area to plunge and print a new low of $25.60. Note the wide-ranging bar; there was also a peak in the indicator plot. Since then, prices managed to recover the $35 level in April 2005. On that occasion, the indicator was overbought above 100 and gave a correct sell signal. In fact, the stock resumed the downtrend. Prices are now testing the previous low hit in November 2004, and the indicator displays a significant positive divergence. |

|
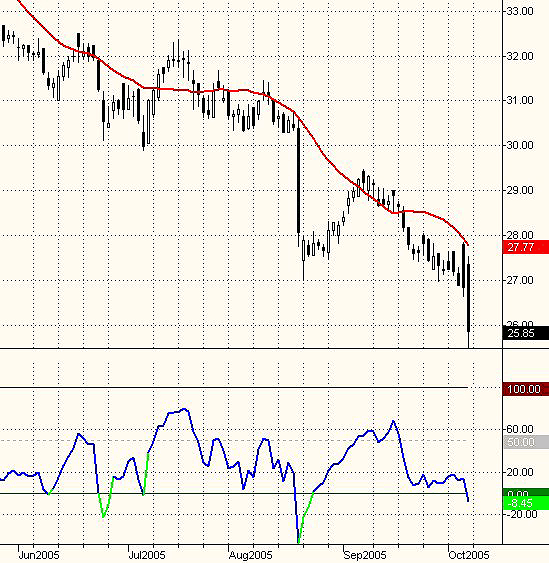
| FIGURE 3: MRK DAILY CHART. The daily chart displays a positive divergence. |
| Graphic provided by: TradeStation. |
| |
| The MRK daily chart in Figure 3 is the most interesting. Prices picked up momentum in the last sessions and displayed very wide-ranging bars breaking out the previous support. The last session plunge was impressive in speed, but showed lower volumes compared to the price bars of August 21-22. The indicator, also in this time frame, is negative and is printing a positive divergence. You know that a divergence alone does not provide a reliable trading signal. You can have multiple divergences with many false indications before you have a correct signal, especially in strong trends. MRK has been in a downtrend for years and this is the first significant divergence shown at the same time in the various time frames. |
Author of the book "Trading the US Markets - A Comprehensive Guide to US Markets for International Traders and Investors" - Harriman House (July 2008)
| Address: | VIA ROBERTO AGO 26 POSTAL CODE 00166 |
| Rome, ITALY | |
| Phone # for sales: | +393357540708 |
| E-mail address: | pezzutti.paolo@tiscali.it |
Click here for more information about our publications!
Comments
Date: 10/10/05Rank: 3Comment:
Date: 10/21/05Rank: 3Comment:

Request Information From Our Sponsors
- StockCharts.com, Inc.
- Candle Patterns
- Candlestick Charting Explained
- Intermarket Technical Analysis
- John Murphy on Chart Analysis
- John Murphy's Chart Pattern Recognition
- John Murphy's Market Message
- MurphyExplainsMarketAnalysis-Intermarket Analysis
- MurphyExplainsMarketAnalysis-Visual Analysis
- StockCharts.com
- Technical Analysis of the Financial Markets
- The Visual Investor
- VectorVest, Inc.
- Executive Premier Workshop
- One-Day Options Course
- OptionsPro
- Retirement Income Workshop
- Sure-Fire Trading Systems (VectorVest, Inc.)
- Trading as a Business Workshop
- VectorVest 7 EOD
- VectorVest 7 RealTime/IntraDay
- VectorVest AutoTester
- VectorVest Educational Services
- VectorVest OnLine
- VectorVest Options Analyzer
- VectorVest ProGraphics v6.0
- VectorVest ProTrader 7
- VectorVest RealTime Derby Tool
- VectorVest Simulator
- VectorVest Variator
- VectorVest Watchdog
