HOT TOPICS LIST
- MACD
- Fibonacci
- RSI
- Gann
- ADXR
- Stochastics
- Volume
- Triangles
- Futures
- Cycles
- Volatility
- ZIGZAG
- MESA
- Retracement
- Aroon
INDICATORS LIST
LIST OF TOPICS
PRINT THIS ARTICLE
by David Penn
A bearish engulfing candlestick and a negative stochastic divergence suggested lower. But natural gas bulls would have none of it.
Position: N/A
David Penn
Technical Writer for Technical Analysis of STOCKS & COMMODITIES magazine, Working-Money.com, and Traders.com Advantage.
PRINT THIS ARTICLE
MACD
About That Gas
10/06/05 03:58:49 PMby David Penn
A bearish engulfing candlestick and a negative stochastic divergence suggested lower. But natural gas bulls would have none of it.
Position: N/A
| I've always thought that one of the best things about technical analysis wasn't that it made it so easy to know when you were right about a trade, but that it was no less easy to know when you are wrong. |
| Back in mid-August, I suggested that a top might have been formed in natural gas futures ("Bears Engulfing Gas," August 19, 2005). The agent of this top was a bearish engulfing candlestick, which, while not as pronounced as the ones described in a more recent Traders.com Advantage article (see my "Bears Engulfing Cocoa," October 6, 2005), the pattern was clear enough for a trader inclined to fade potential reversals to take a poke at gas. |

|
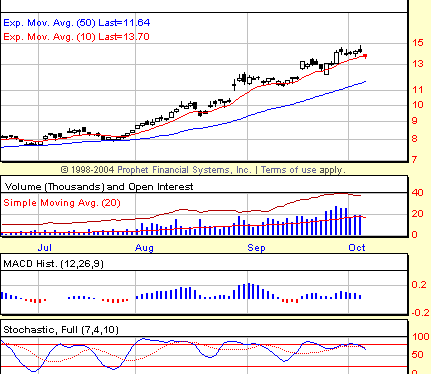
| FIGURE 1: NATURAL GAS. The surge in the MACD histogram in late August/early September was a warning that higher prices in natural gas futures were more likely than lower ones in the near term. |
| Graphic provided by: Prophet Financial, Inc. |
| |
| As far as reversals go, it is hard to imagine one much more short-lived. After gapping down pursuant to the negative stochastic divergence and the bearish engulfing candlestick, natural gas futures began moving back up above the 10-day exponential moving average (in red). (See Figure 1.) Even though the days had all the earmarks of distribution (black real bodies in the candlesticks signifying closes lower than opens), prices were still above that key, short-term moving average and edging higher. Late in August, natural gas futures gapped up and any illusion of an enduring correction was dashed. What lessons can be learned -- beyond the obvious ones of keeping tight stops until positions have moved significantly in the trader's favor? Note the size of the moving average convergence/divergence (MACD) histogram in the first half of August. It is clearly stronger (that is, higher) than any recent MACDH peak or trough that preceded it going back at least a few months. While I still think that there can be great opportunity in fading prices as the climb against negative divergences and bearish reversal candlesticks, I also respect the fact that an "extreme" MACD histogram means that prices will likely continue in the direction of the extreme. In this case that meant, correction or pullback notwithstanding, natural gas prices were going higher before they went meaningfully lower. |
| The MACD histogram at the end of August and the beginning of September was even more powerfully bullish than the one in the first half of August, as prices gapped up again going into the autumn. Again, my reading of MACD histograms (see my Working-Money.com article, "Post-Breakdown MACDH Extremes," May 19, 2004) suggests that extremes in one direction or the other are not to be faded. That reading would have proved helpful as September saw natural gas prices again bound higher. |
| It is worth noting that natural gas has been running negative stochastic divergence ever since its rally began this summer. In fact, the peaks in July, August, and late September were all accompanied by negative stochastic divergences. What is different about the most recent late September peak is that there is also a negative divergence in the MACDH. While I tend to put more weight on stochastic divergences than MACDH divergences -- at least on daily charts -- the fact that the MACDH is decreasingly bullish (smaller positive values) is another warning that the bull run in natural gas might be closer to its conclusion than many energy traders think. |
Technical Writer for Technical Analysis of STOCKS & COMMODITIES magazine, Working-Money.com, and Traders.com Advantage.
| Title: | Technical Writer |
| Company: | Technical Analysis, Inc. |
| Address: | 4757 California Avenue SW |
| Seattle, WA 98116 | |
| Phone # for sales: | 206 938 0570 |
| Fax: | 206 938 1307 |
| Website: | www.Traders.com |
| E-mail address: | DPenn@traders.com |
Traders' Resource Links | |
| Charting the Stock Market: The Wyckoff Method -- Books | |
| Working-Money.com -- Online Trading Services | |
| Traders.com Advantage -- Online Trading Services | |
| Technical Analysis of Stocks & Commodities -- Publications and Newsletters | |
| Working Money, at Working-Money.com -- Publications and Newsletters | |
| Traders.com Advantage -- Publications and Newsletters | |
| Professional Traders Starter Kit -- Software | |
Click here for more information about our publications!
Comments
Date: 10/06/05Rank: 3Comment:
Date: 10/21/05Rank: 3Comment:

Request Information From Our Sponsors
- StockCharts.com, Inc.
- Candle Patterns
- Candlestick Charting Explained
- Intermarket Technical Analysis
- John Murphy on Chart Analysis
- John Murphy's Chart Pattern Recognition
- John Murphy's Market Message
- MurphyExplainsMarketAnalysis-Intermarket Analysis
- MurphyExplainsMarketAnalysis-Visual Analysis
- StockCharts.com
- Technical Analysis of the Financial Markets
- The Visual Investor
- VectorVest, Inc.
- Executive Premier Workshop
- One-Day Options Course
- OptionsPro
- Retirement Income Workshop
- Sure-Fire Trading Systems (VectorVest, Inc.)
- Trading as a Business Workshop
- VectorVest 7 EOD
- VectorVest 7 RealTime/IntraDay
- VectorVest AutoTester
- VectorVest Educational Services
- VectorVest OnLine
- VectorVest Options Analyzer
- VectorVest ProGraphics v6.0
- VectorVest ProTrader 7
- VectorVest RealTime Derby Tool
- VectorVest Simulator
- VectorVest Variator
- VectorVest Watchdog
