HOT TOPICS LIST
- MACD
- Fibonacci
- RSI
- Gann
- ADXR
- Stochastics
- Volume
- Triangles
- Futures
- Cycles
- Volatility
- ZIGZAG
- MESA
- Retracement
- Aroon
INDICATORS LIST
LIST OF TOPICS
PRINT THIS ARTICLE
by David Penn
Bearish engulfing candlesticks and volume contractions marked tops in cocoa rallies this year.
Position: N/A
David Penn
Technical Writer for Technical Analysis of STOCKS & COMMODITIES magazine, Working-Money.com, and Traders.com Advantage.
PRINT THIS ARTICLE
CANDLESTICK CHARTING
Bears Engulfing Cocoa
10/06/05 03:43:36 PMby David Penn
Bearish engulfing candlesticks and volume contractions marked tops in cocoa rallies this year.
Position: N/A
| One of the interesting things about candlestick analysis is that while it can be a great complement to trend and swing trading, it can also help an analyst make sense of price action that seems to be all over the place. |
| Much of the recent volatility in commodities -- from softs to grains and from metals to meats -- has fallen into this category. Traders accustomed to following trends or buying short-term oversold conditions in otherwise trending markets are likely frustrated by the wild whips of many commodities over the past several months. |

|
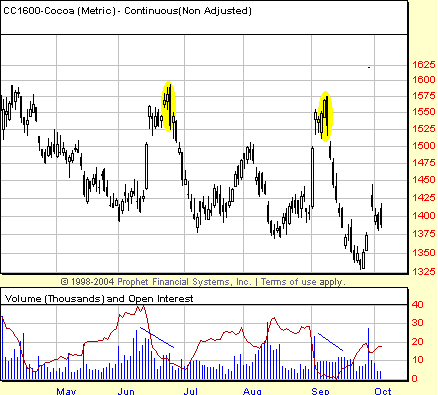
| FIGURE 1: In June and September, short, sharp rallies in cocoa futures were met with bearish engulfing candlesticks that accurately anticipated reversals. Note also the contraction in volume on the higher highs that accompany the engulfing candlesticks. |
| Graphic provided by: Prophet Financial, Inc. |
| |
| But a close -- or simply candlestick-oriented -- look at some of these charts reveals that even in the wild whips of price action, there are opportunities for traders to make reasonable speculations on near-term price moves. Consider, for example, the price chart of continuous cocoa futures in Figure 1. Clearly, cocoa prices are trending downward over the course of the months shown. Yet the average trend trader would not have been able to endure the powerful, countertrend spikes in June and September, even as cocoa prices were decidedly lower in early October than they were in late April. |
| How could a trader have dealt with this environment? Note how both price spikes -- in June and again in September -- consist of the same parts: a wide-ranging bar after prices form a short-term (that is, intramonth) higher low, a gap up after the wide-ranging bar into a new high, a very short-term pullback, then a push to a higher high. After that, in both cases, a bearish engulfing candlestick is formed -- and prices retreat immediately afterward, just as sharply as they had previously rallied. In both cases, volume contracted on the second, intramonth high. What traders were left with was a pair of island tops -- prices gapped down at approximately the same level at which they had previously gapped up. |
| While there were numerous opportunities for traders to enjoin the selling that hit the cocoa market in the wake of the bearish engulfing candlesticks, it is no less clear that early adopters of the downward move were the ones most amply rewarded. An entry a few points under the low of both engulfing candlesticks would have allowed a brief bit of pain for traders short the June spike. For example, an entry at the level of the low of the June engulfing candlestick would have endured about 25 points, or $250, of discomfort on the first day, but the same entry would be up 19 points the day after and 28 points the day after that -- with even more significant gains shortly thereafter. A similarly positioned entry following the September engulfing candlestick, on the other hand, would have required no pain whatsoever. |
Technical Writer for Technical Analysis of STOCKS & COMMODITIES magazine, Working-Money.com, and Traders.com Advantage.
| Title: | Technical Writer |
| Company: | Technical Analysis, Inc. |
| Address: | 4757 California Avenue SW |
| Seattle, WA 98116 | |
| Phone # for sales: | 206 938 0570 |
| Fax: | 206 938 1307 |
| Website: | www.Traders.com |
| E-mail address: | DPenn@traders.com |
Traders' Resource Links | |
| Charting the Stock Market: The Wyckoff Method -- Books | |
| Working-Money.com -- Online Trading Services | |
| Traders.com Advantage -- Online Trading Services | |
| Technical Analysis of Stocks & Commodities -- Publications and Newsletters | |
| Working Money, at Working-Money.com -- Publications and Newsletters | |
| Traders.com Advantage -- Publications and Newsletters | |
| Professional Traders Starter Kit -- Software | |
Click here for more information about our publications!
Comments
Date: 10/06/05Rank: 4Comment:
Date: 10/21/05Rank: 3Comment:

Request Information From Our Sponsors
- VectorVest, Inc.
- Executive Premier Workshop
- One-Day Options Course
- OptionsPro
- Retirement Income Workshop
- Sure-Fire Trading Systems (VectorVest, Inc.)
- Trading as a Business Workshop
- VectorVest 7 EOD
- VectorVest 7 RealTime/IntraDay
- VectorVest AutoTester
- VectorVest Educational Services
- VectorVest OnLine
- VectorVest Options Analyzer
- VectorVest ProGraphics v6.0
- VectorVest ProTrader 7
- VectorVest RealTime Derby Tool
- VectorVest Simulator
- VectorVest Variator
- VectorVest Watchdog
- StockCharts.com, Inc.
- Candle Patterns
- Candlestick Charting Explained
- Intermarket Technical Analysis
- John Murphy on Chart Analysis
- John Murphy's Chart Pattern Recognition
- John Murphy's Market Message
- MurphyExplainsMarketAnalysis-Intermarket Analysis
- MurphyExplainsMarketAnalysis-Visual Analysis
- StockCharts.com
- Technical Analysis of the Financial Markets
- The Visual Investor
