HOT TOPICS LIST
- MACD
- Fibonacci
- RSI
- Gann
- ADXR
- Stochastics
- Volume
- Triangles
- Futures
- Cycles
- Volatility
- ZIGZAG
- MESA
- Retracement
- Aroon
INDICATORS LIST
LIST OF TOPICS
PRINT THIS ARTICLE
by Arthur Hill
IBM is showing some relative strength lately and should be watched closely for a potential breakout that could revive the tech sector.
Position: Hold
Arthur Hill
Arthur Hill is currently editor of TDTrader.com, a website specializing in trading strategies, sector/industry specific breadth stats and overall technical analysis. He passed the Society of Technical Analysts (STA London) diploma exam with distinction is a Certified Financial Technician (CFTe). Prior to TD Trader, he was the Chief Technical Analyst for Stockcharts.com and the main contributor to the ChartSchool.
PRINT THIS ARTICLE
REL. STR COMPARATIVE
Big Blue Shows Relative Strength
10/06/05 07:48:47 AMby Arthur Hill
IBM is showing some relative strength lately and should be watched closely for a potential breakout that could revive the tech sector.
Position: Hold
| While the Standard & Poor's 500 broke its late September low and support at 1200 in early October, IBM held firm this month and is challenging resistance. IBM's ability to hold well above its late September low shows relative strength, and this is often one of the first signs of absolute strength. |

|
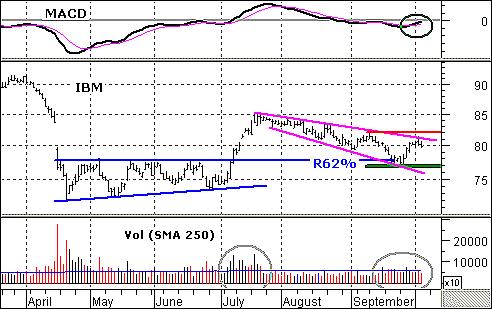
| FIGURE 1: IBM. IBM stock declined in price from mid-July to September and formed a falling consolidation. |
| Graphic provided by: MetaStock. |
| Graphic provided by: QuoteCenter Data. |
| |
| On the price chart (Figure 1), the stock declined from mid-July to late September and formed a falling consolidation. The pattern is widening over the last few weeks and does not look like a typical flag with parallel lines. Despite the oddness of this decline, I think it looks more corrective than impulsive. The stock surged on good volume in July and fell on low volume over the summer, and upside volume is starting to pick up in late September (gray ovals). Low-volume declines are usually corrective. In addition, the stock found support near the 62% retracement mark and broken resistance (77-78). This is where a correction should end. |
| The final signal would be a breakout at 82, and this would signal a continuation of the July advance. As long as resistance at 82 holds, the bears still have the upper hand and a reversal is only potential, not proven. Traders should also watch the moving average convergence/divergence (MACD), as it turned up recently and is poised to move into positive territory. |
Arthur Hill is currently editor of TDTrader.com, a website specializing in trading strategies, sector/industry specific breadth stats and overall technical analysis. He passed the Society of Technical Analysts (STA London) diploma exam with distinction is a Certified Financial Technician (CFTe). Prior to TD Trader, he was the Chief Technical Analyst for Stockcharts.com and the main contributor to the ChartSchool.
| Title: | Editor |
| Company: | TDTrader.com |
| Address: | Willem Geetsstraat 17 |
| Mechelen, B2800 | |
| Phone # for sales: | 3215345465 |
| Website: | www.tdtrader.com |
| E-mail address: | arthurh@tdtrader.com |
Traders' Resource Links | |
| TDTrader.com has not added any product or service information to TRADERS' RESOURCE. | |
Click here for more information about our publications!
Comments
Date: 10/06/05Rank: 4Comment:
Date: 10/21/05Rank: 4Comment:

Request Information From Our Sponsors
- VectorVest, Inc.
- Executive Premier Workshop
- One-Day Options Course
- OptionsPro
- Retirement Income Workshop
- Sure-Fire Trading Systems (VectorVest, Inc.)
- Trading as a Business Workshop
- VectorVest 7 EOD
- VectorVest 7 RealTime/IntraDay
- VectorVest AutoTester
- VectorVest Educational Services
- VectorVest OnLine
- VectorVest Options Analyzer
- VectorVest ProGraphics v6.0
- VectorVest ProTrader 7
- VectorVest RealTime Derby Tool
- VectorVest Simulator
- VectorVest Variator
- VectorVest Watchdog
- StockCharts.com, Inc.
- Candle Patterns
- Candlestick Charting Explained
- Intermarket Technical Analysis
- John Murphy on Chart Analysis
- John Murphy's Chart Pattern Recognition
- John Murphy's Market Message
- MurphyExplainsMarketAnalysis-Intermarket Analysis
- MurphyExplainsMarketAnalysis-Visual Analysis
- StockCharts.com
- Technical Analysis of the Financial Markets
- The Visual Investor
