HOT TOPICS LIST
- MACD
- Fibonacci
- RSI
- Gann
- ADXR
- Stochastics
- Volume
- Triangles
- Futures
- Cycles
- Volatility
- ZIGZAG
- MESA
- Retracement
- Aroon
INDICATORS LIST
LIST OF TOPICS
PRINT THIS ARTICLE
by Arthur Hill
After a long, drawn-out consolidation, the S&P 100 made a directional decision with a big support break.
Position: Sell
Arthur Hill
Arthur Hill is currently editor of TDTrader.com, a website specializing in trading strategies, sector/industry specific breadth stats and overall technical analysis. He passed the Society of Technical Analysts (STA London) diploma exam with distinction is a Certified Financial Technician (CFTe). Prior to TD Trader, he was the Chief Technical Analyst for Stockcharts.com and the main contributor to the ChartSchool.
PRINT THIS ARTICLE
HEAD & SHOULDERS
OEX Breaks Neckline Support
10/06/05 07:38:29 AMby Arthur Hill
After a long, drawn-out consolidation, the S&P 100 made a directional decision with a big support break.
Position: Sell
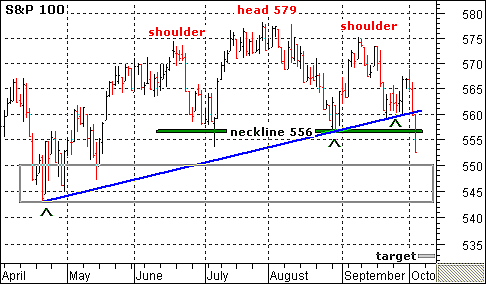
| The pattern over the last four months looks like a head-and-shoulders reversal (Figure 1). These are distribution patterns that are confirmed with a break below neckline support (~556). The lower high of the right shoulder shows a failed rally and buyer weakness because the bulls were not strong enough to match or exceed the prior high (head). The support break (neckline) shows increased selling pressure and it is this break that reverses the uptrend. |

|
| FIGURE 1: S&P 100. The head and shoulders reversal seen here was accompanied by a break in the April trendline. The line defined the medium-term uptrend and was touched three times (green carets). |
| Graphic provided by: MetaStock. |
| Graphic provided by: QuoteCenter Data. |
| |
| In addition to the neckline support break, the index also broke the April trendline. This line defined the medium-term uptrend and was touched three times (green carets). It takes two touches to draw a trendline, and this third touch (late September) further validates the trendline. |
| Based on traditional technical analysis, the downside projection is to around 533. The distance from the head to the neckline is subtracted from the neckline break for a downside target. I also see a support zone around 545 from the late April lows and this may provide a bounce or consolidation. Look for neckline support to turn into resistance. A bounce back to the 556 area may provide a second chance for the bears to participate. |
Arthur Hill is currently editor of TDTrader.com, a website specializing in trading strategies, sector/industry specific breadth stats and overall technical analysis. He passed the Society of Technical Analysts (STA London) diploma exam with distinction is a Certified Financial Technician (CFTe). Prior to TD Trader, he was the Chief Technical Analyst for Stockcharts.com and the main contributor to the ChartSchool.
| Title: | Editor |
| Company: | TDTrader.com |
| Address: | Willem Geetsstraat 17 |
| Mechelen, B2800 | |
| Phone # for sales: | 3215345465 |
| Website: | www.tdtrader.com |
| E-mail address: | arthurh@tdtrader.com |
Traders' Resource Links | |
| TDTrader.com has not added any product or service information to TRADERS' RESOURCE. | |
Click here for more information about our publications!
Comments
Date: 10/06/05Rank: 4Comment:
Date: 10/21/05Rank: 5Comment:

Request Information From Our Sponsors
- StockCharts.com, Inc.
- Candle Patterns
- Candlestick Charting Explained
- Intermarket Technical Analysis
- John Murphy on Chart Analysis
- John Murphy's Chart Pattern Recognition
- John Murphy's Market Message
- MurphyExplainsMarketAnalysis-Intermarket Analysis
- MurphyExplainsMarketAnalysis-Visual Analysis
- StockCharts.com
- Technical Analysis of the Financial Markets
- The Visual Investor
- VectorVest, Inc.
- Executive Premier Workshop
- One-Day Options Course
- OptionsPro
- Retirement Income Workshop
- Sure-Fire Trading Systems (VectorVest, Inc.)
- Trading as a Business Workshop
- VectorVest 7 EOD
- VectorVest 7 RealTime/IntraDay
- VectorVest AutoTester
- VectorVest Educational Services
- VectorVest OnLine
- VectorVest Options Analyzer
- VectorVest ProGraphics v6.0
- VectorVest ProTrader 7
- VectorVest RealTime Derby Tool
- VectorVest Simulator
- VectorVest Variator
- VectorVest Watchdog
