HOT TOPICS LIST
- MACD
- Fibonacci
- RSI
- Gann
- ADXR
- Stochastics
- Volume
- Triangles
- Futures
- Cycles
- Volatility
- ZIGZAG
- MESA
- Retracement
- Aroon
INDICATORS LIST
LIST OF TOPICS
PRINT THIS ARTICLE
by Paolo Pezzutti
Goldman Sachs has downgraded Texas Instruments to underperform, assuming margins are at their cyclical peak.
Position: N/A
Paolo Pezzutti
Author of the book "Trading the US Markets - A Comprehensive Guide to US Markets for International Traders and Investors" - Harriman House (July 2008)
PRINT THIS ARTICLE
MACD
Texas Instruments Shows An MACD Negative Divergence
10/05/05 10:16:39 AMby Paolo Pezzutti
Goldman Sachs has downgraded Texas Instruments to underperform, assuming margins are at their cyclical peak.
Position: N/A
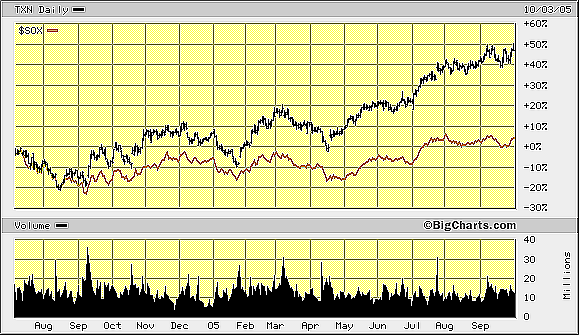
| Goldman Sachs downgraded Texas Instruments (TXN) to underperform, saying it believes margins are cyclically peaking. The view on semiconductor fundamentals and the cycle was not changed. The news hit the stock, testing the resistance at $34. You can assess the security strength and performance potential, associating technical conditions and information coming from investors' reaction to negative news. The company has a good profit track record with a gross margin of 48%, and lately, the stock has outperformed several other companies in the semiconductor sector. This situation is reflected in the daily chart of TXN (Figure 1). |

|
| FIGURE 1: TEXAS INSTRUMENTS DAILY CHART. TXN significantly outperformed the semiconductor index. |
| Graphic provided by: BigCharts.com. |
| |
| Since July 2004, the stock has consistently outperformed the semiconductor index. The stock rose about 50%, while the index printed only a performance of about 5%. |

|
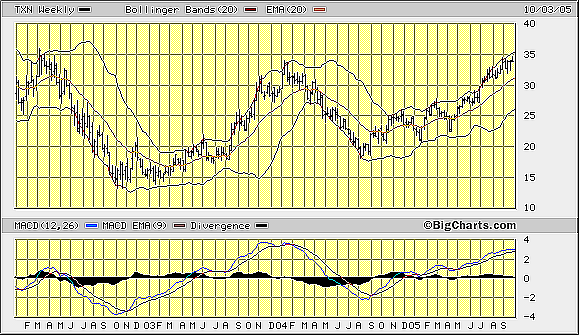
| FIGURE 2: TXN WEEKLY. After the bubble burst, prices managed to recover from the lows. During the past three years, the stock printed an uptrend characterized by big swings that brought prices up. |
| Graphic provided by: BigCharts.com. |
| |
| In Figure 2, you can see the TXN weekly chart. After the heavy losses following the end of the bubble of the 1990s, TXN managed to recover from the lows. During the past three years, the stock printed an uptrend characterized by big swings that brought prices from a low of about $14 up to the present $34. I will use the moving average convergence/divergence (MACD) indicator to study the stock's technical situation. Note that the indicator has given two valuable signals in the past few years. The first occurred in January 2003, when it printed a very significant divergence. Prices, after a retest of the previous low, started an upmove of more than 100%. The second divergence was printed in coincidence with the January 2004 top. The MACD is positive, above its average, but is currently flat. In this time frame, prices have entered a four-week congestion area. After a strong upmove, prices did not manage to tag the upper Bollinger Band. As a result, the bands are still parallel and rising. |

|
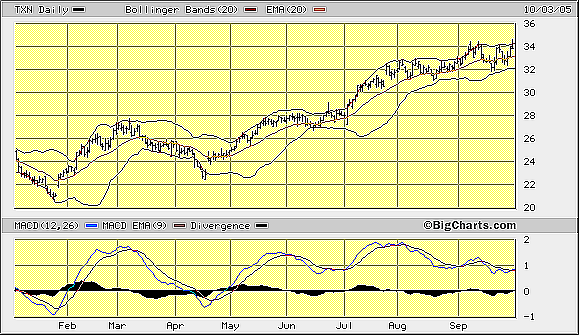
| FIGURE 3: TXN DAILY CHART. The daily chart prints a MACD negative divergence. |
| Graphic provided by: BigCharts.com. |
| |
| In Figure 3, you can see the TXN daily chart. The uptrend in 2005 brought prices from a low of about $21 to the present $34. Note how the MACD, in this case, has provided excellent entry/exit signals. This is typical when a security has big swings. The indicator did not provide false signals throughout the period. Of course, you cannot forecast the effectiveness of any indicator. You have to use it with other tools to find confirmation of the indications you have. In September, the stock entered a trading range between $32 and $34. You can see the Bollinger Bands are flat and parallel. It means the stock is in a trading range environment without any indication of directionality so far. The MACD printed a very important divergence when prices reached the top above $34 at the beginning of the month. The news of the downgrading hit the stock right when testing resistance for the second time. Now, because of the news, it is important to assess the investors' change of attitude. Given the technical situation, I do not expect significant negative reactions in the intermediate term, unless other technical factors emerge. In the short term, prices could move toward at least the lower part of the trading range. This view is supported by the negative divergence of MACD. Switching to a breakout trading style would be a possible strategy, should prices approach the resistance again. |
Author of the book "Trading the US Markets - A Comprehensive Guide to US Markets for International Traders and Investors" - Harriman House (July 2008)
| Address: | VIA ROBERTO AGO 26 POSTAL CODE 00166 |
| Rome, ITALY | |
| Phone # for sales: | +393357540708 |
| E-mail address: | pezzutti.paolo@tiscali.it |
Click here for more information about our publications!
Comments
Date: 10/05/05Rank: 3Comment:
Date: 10/12/05Rank: 4Comment:
Date: 10/21/05Rank: 3Comment:

|

Request Information From Our Sponsors
- StockCharts.com, Inc.
- Candle Patterns
- Candlestick Charting Explained
- Intermarket Technical Analysis
- John Murphy on Chart Analysis
- John Murphy's Chart Pattern Recognition
- John Murphy's Market Message
- MurphyExplainsMarketAnalysis-Intermarket Analysis
- MurphyExplainsMarketAnalysis-Visual Analysis
- StockCharts.com
- Technical Analysis of the Financial Markets
- The Visual Investor
- VectorVest, Inc.
- Executive Premier Workshop
- One-Day Options Course
- OptionsPro
- Retirement Income Workshop
- Sure-Fire Trading Systems (VectorVest, Inc.)
- Trading as a Business Workshop
- VectorVest 7 EOD
- VectorVest 7 RealTime/IntraDay
- VectorVest AutoTester
- VectorVest Educational Services
- VectorVest OnLine
- VectorVest Options Analyzer
- VectorVest ProGraphics v6.0
- VectorVest ProTrader 7
- VectorVest RealTime Derby Tool
- VectorVest Simulator
- VectorVest Variator
- VectorVest Watchdog
