HOT TOPICS LIST
- MACD
- Fibonacci
- RSI
- Gann
- ADXR
- Stochastics
- Volume
- Triangles
- Futures
- Cycles
- Volatility
- ZIGZAG
- MESA
- Retracement
- Aroon
INDICATORS LIST
LIST OF TOPICS
PRINT THIS ARTICLE
by Dennis D. Peterson
The Chaikin Oscillator can be a very useful indicator when applied under the right conditions.
Position: N/A
Dennis D. Peterson
Market index trading on a daily basis.
PRINT THIS ARTICLE
CHAIKIN OSCILLATOR
The Chaikin Oscillator
07/27/00 03:33:30 PMby Dennis D. Peterson
The Chaikin Oscillator can be a very useful indicator when applied under the right conditions.
Position: N/A
| The Chaikin oscillator, created by Marc Chaikin, uses the difference between a three- and ten-day exponential moving average of the accumulation/distribution line. In Metastock the formula is: mov(ad(),3,E) - mov(ad(),10,E), where "mov" is the moving average, "ad()" is the accumulation./distribution line, the numbers 3 and 10 the periods, and "E" the exponential moving average. The Chaikin oscillator is an indicator of an indicator, making it a momentum indicator. In this case it measures changes in the accumulation/distribution line. The formula for the accumulation/distribution line is: [ [ [ ( close -low ) - ( high -close ) ] / (high -low) ] x volume ] + I, where I is the previous day's accumulation/distribution value. The formula is based on the notion that if the close is above the midpoint of the day's high and low ((high + low)/2), the security is being accumulated, and if below it's being distributed. Since it's an oscillator, it can be used as an indication of reversal when extreme values are obtained and as a warning of a potential reversal when there is a divergence. |
| As an indicator of an indicator the strongest signal should be used. Chaikin suggests the following rules for use: 1. Wait for prices to reach a new high or low at an overbought or oversold point in time. 2. The oscillator reverses at an extreme level, with the current extreme level not exceeding a previous level. |

|
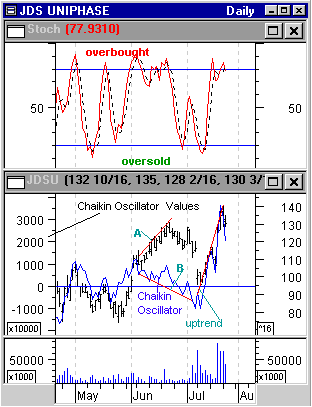
| Figure 1: Stochastic for JDSU; JDSU price chart with Chaikin oscillator overlay. Stochastics show JDSU oversold in mid-July (A). The Chaikin oscillator (blue overlay on JDSU price chart) shows a strong uptrend starting in early July. |
| Graphic provided by: MetaStock. |
| |
| Figure 1 uses the stochastic oscillator to find an oversold condition of JDSU in mid-July. The Chaikin oscillator is at an extreme low value in mid-July, and the mid-July extreme is not as low as the Chaikin oscillator extreme in mid-April. The Chaikin uptrend is pronounced in mid-July, which is the type of action you look for when using an indicator of an indicator. The ability to show a divergence is seen in the Chaikin oscillator downtrend at B and the price increase at A. For this divergence and reversal the conditions are again met: (1) JDSU reaches an overbought condition at the beginning of June as indicated by the stochastic; (2) the Chaikin oscillator reaches an extreme level at the beginning of June that is less than the April Chaikin extreme. |
| In hindsight it looks obvious. But if you go back in time to the beginning of June, JDSU is one of the powerhouses in fiber optics. We all know bandwidth is the answer. JDSU has just gapped up at the beginning of June. Later on, the news wires are aglow with the E-TEK Dynamics merger. Both JDSU and E-TEK Dynamics are getting pops from the merger and the Nasdaq has just gapped up at the beginning of June. How good can it get? Surely JDSU will consolidate its gains and just go up. Who could predict the price decline in mid-June? Ask Chaikin. |
Market index trading on a daily basis.
| Title: | Staff Writer |
| Company: | Technical Analysis, Inc. |
| Address: | 4757 California Ave SW |
| Seattle, WA 98116-4499 | |
| Phone # for sales: | 206 938 0570 |
| Fax: | 206 938 1307 |
| Website: | www.traders.com |
| E-mail address: | dpeterson@traders.com |
Traders' Resource Links | |
| Charting the Stock Market: The Wyckoff Method -- Books | |
| Working-Money.com -- Online Trading Services | |
| Traders.com Advantage -- Online Trading Services | |
| Technical Analysis of Stocks & Commodities -- Publications and Newsletters | |
| Working Money, at Working-Money.com -- Publications and Newsletters | |
| Traders.com Advantage -- Publications and Newsletters | |
| Professional Traders Starter Kit -- Software | |
Click here for more information about our publications!
Comments
Date: / /Rank: 4Comment:

Request Information From Our Sponsors
- StockCharts.com, Inc.
- Candle Patterns
- Candlestick Charting Explained
- Intermarket Technical Analysis
- John Murphy on Chart Analysis
- John Murphy's Chart Pattern Recognition
- John Murphy's Market Message
- MurphyExplainsMarketAnalysis-Intermarket Analysis
- MurphyExplainsMarketAnalysis-Visual Analysis
- StockCharts.com
- Technical Analysis of the Financial Markets
- The Visual Investor
- VectorVest, Inc.
- Executive Premier Workshop
- One-Day Options Course
- OptionsPro
- Retirement Income Workshop
- Sure-Fire Trading Systems (VectorVest, Inc.)
- Trading as a Business Workshop
- VectorVest 7 EOD
- VectorVest 7 RealTime/IntraDay
- VectorVest AutoTester
- VectorVest Educational Services
- VectorVest OnLine
- VectorVest Options Analyzer
- VectorVest ProGraphics v6.0
- VectorVest ProTrader 7
- VectorVest RealTime Derby Tool
- VectorVest Simulator
- VectorVest Variator
- VectorVest Watchdog
