HOT TOPICS LIST
- MACD
- Fibonacci
- RSI
- Gann
- ADXR
- Stochastics
- Volume
- Triangles
- Futures
- Cycles
- Volatility
- ZIGZAG
- MESA
- Retracement
- Aroon
INDICATORS LIST
LIST OF TOPICS
PRINT THIS ARTICLE
by David Penn
Correction or reversal, December gold takes a break from its recent run higher.
Position: N/A
David Penn
Technical Writer for Technical Analysis of STOCKS & COMMODITIES magazine, Working-Money.com, and Traders.com Advantage.
PRINT THIS ARTICLE
GOLD & METALS
Time Out For Gold
10/04/05 08:19:44 AMby David Penn
Correction or reversal, December gold takes a break from its recent run higher.
Position: N/A
| Was it "the Twist"? How about "the Jerk?" Maybe a little "moonwalking"? |
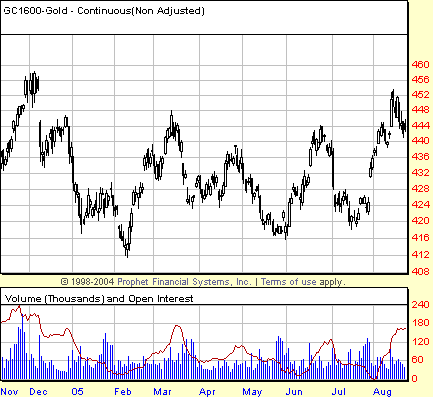
| I'm tempted to invite Traders.com Advantage readers to send in the name of the rug their friendly neighborhood gold bug has been cutting for the past several weeks as gold has lurched higher and higher. It's hard to blame them, though. Take a look at the gold market over the past several months and you'll see why owners and buyers of gold have been dancing a jig since late summer. Starting near 475 in late 2004, gold fell below 425 by February 2005, then rallied to near 460 by March, back down near 425 by June, then back up to near 450 by mid-June only to fall back to 425 by mid-July (see Figure 1). |

|
| FIGURE 1: WILD SWINGS FOR GOLD. A market for traders, maybe, but many gold investors endured a sizable amount of anxiety as a result of the wild swings of gold during most of 2005. |
| Graphic provided by: Prophet Financial, Inc. |
| |
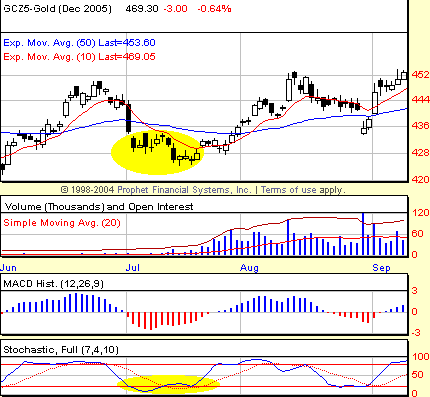
| The technical origins of the late summer rally in gold can be found in the positive stochastic and moving average convergence/divergence (MACD) histogram divergences that accompanied the yellow metal's low in the first half of July (compare with the low during May, which did not produce a similarly bullish divergence)(Figure 2). There was also a TRIX buy signal in mid-July that was confirmed by a close above the high of the buy signal session (while other nearby TRIX sell signals went unconfirmed). |

|
| FIGURE 2: TEMPORARY SKID? Positive divergences in the 7,10 stochastic and the MACD histogram were strong warnings that the decline in the first half of July might be short-lived. |
| Graphic provided by: Prophet Financial, Inc. |
| |
| Although the gold market endured a sharp correction during the second half of August (a correction that retraced more than 61.8% of the rally from the mid-July low), the summer rally in gold was real. Along with the stock market, gold futures roared into September, taking out the August highs by mid-September and continuing to bounce higher. The March highs just shy of 460 were the next to go down. Finally, the big-time highs of December 2004 just shy of 470 were felled as gold just kept on going, and going, and going. |

|
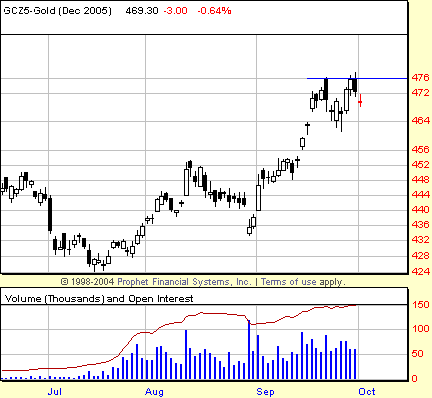
| FIGURE 3: TOP AND RALLY. A 2B top late in September might provide time for the gold rally to consolidate recent gains before moving higher. |
| Graphic provided by: Prophet Financial, Inc. |
| |
| But the nature of gold's rise over September has created a market that might be too extended for its own good--at least temporarily. Not only has December gold developed a caution-inducing negative stochastic divergence in late September, but there is also a 2B top that threatens to send gold futures back toward the nearest support in the mid-450s. Although not shown in Figure 3, this level is also consistent with the 50-day exponential moving average (EMA). The 2B top is created when a market makes a high, pulls back and makes a higher high, yet fails to follow through to the upside in the wake of the second high (the "higher high"). While this much has already happened in late September, there is a confirming/entry step that has not. This comes only as prices retreat from new high territory and begin to move lower instead. Generally, the low of the initial high is considering the level at which a trader or speculator following the 2B top methodology would look to go short. In the current case, that level is 466.80 -- less than 1.40 away from Monday's low. |
Technical Writer for Technical Analysis of STOCKS & COMMODITIES magazine, Working-Money.com, and Traders.com Advantage.
| Title: | Technical Writer |
| Company: | Technical Analysis, Inc. |
| Address: | 4757 California Avenue SW |
| Seattle, WA 98116 | |
| Phone # for sales: | 206 938 0570 |
| Fax: | 206 938 1307 |
| Website: | www.Traders.com |
| E-mail address: | DPenn@traders.com |
Traders' Resource Links | |
| Charting the Stock Market: The Wyckoff Method -- Books | |
| Working-Money.com -- Online Trading Services | |
| Traders.com Advantage -- Online Trading Services | |
| Technical Analysis of Stocks & Commodities -- Publications and Newsletters | |
| Working Money, at Working-Money.com -- Publications and Newsletters | |
| Traders.com Advantage -- Publications and Newsletters | |
| Professional Traders Starter Kit -- Software | |
Click here for more information about our publications!
Comments
Date: 10/04/05Rank: 3Comment:
Date: 10/05/05Rank: 4Comment:
Date: 10/21/05Rank: 3Comment:

Request Information From Our Sponsors
- StockCharts.com, Inc.
- Candle Patterns
- Candlestick Charting Explained
- Intermarket Technical Analysis
- John Murphy on Chart Analysis
- John Murphy's Chart Pattern Recognition
- John Murphy's Market Message
- MurphyExplainsMarketAnalysis-Intermarket Analysis
- MurphyExplainsMarketAnalysis-Visual Analysis
- StockCharts.com
- Technical Analysis of the Financial Markets
- The Visual Investor
- VectorVest, Inc.
- Executive Premier Workshop
- One-Day Options Course
- OptionsPro
- Retirement Income Workshop
- Sure-Fire Trading Systems (VectorVest, Inc.)
- Trading as a Business Workshop
- VectorVest 7 EOD
- VectorVest 7 RealTime/IntraDay
- VectorVest AutoTester
- VectorVest Educational Services
- VectorVest OnLine
- VectorVest Options Analyzer
- VectorVest ProGraphics v6.0
- VectorVest ProTrader 7
- VectorVest RealTime Derby Tool
- VectorVest Simulator
- VectorVest Variator
- VectorVest Watchdog
