HOT TOPICS LIST
- MACD
- Fibonacci
- RSI
- Gann
- ADXR
- Stochastics
- Volume
- Triangles
- Futures
- Cycles
- Volatility
- ZIGZAG
- MESA
- Retracement
- Aroon
INDICATORS LIST
LIST OF TOPICS
PRINT THIS ARTICLE
by Arthur Hill
The consolidation in silver is narrowing as the triangle trendlines converge and Bollinger Bands contract.
Position: Hold
Arthur Hill
Arthur Hill is currently editor of TDTrader.com, a website specializing in trading strategies, sector/industry specific breadth stats and overall technical analysis. He passed the Society of Technical Analysts (STA London) diploma exam with distinction is a Certified Financial Technician (CFTe). Prior to TD Trader, he was the Chief Technical Analyst for Stockcharts.com and the main contributor to the ChartSchool.
PRINT THIS ARTICLE
BOLLINGER BANDS
Silver Strings Out Consolidation
10/04/05 07:52:58 AMby Arthur Hill
The consolidation in silver is narrowing as the triangle trendlines converge and Bollinger Bands contract.
Position: Hold
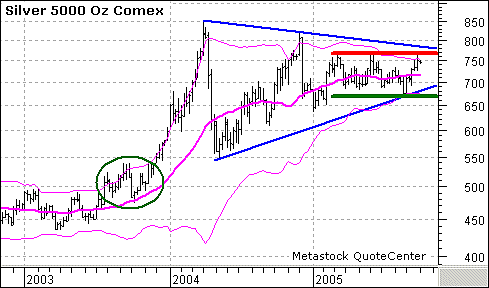
| The weekly chart for COMEX silver (5,000 oz. continuous futures) shows a large triangle extending back to April 2004 (Figure 1). Silver surged from 434 to 850 and then began this consolidation to digest these massive gains. A triangle formed, and these are neutral patterns dependent on a breakout for a directional bias. |

|
| FIGURE 1: COMEX SILVER WEEKLY. Silver surged and began a consolidation to digest these massive gains. |
| Graphic provided by: MetaStock. |
| Graphic provided by: QuoteCenter Data. |
| |
| The trading range has been tightening even more over the last seven months. Silver has traded between 670 and 770 since March, and the pattern looks like a rectangle. This pattern is also neutral and dependent on a breakout for a directional bias. A move above 770 would be bullish and a move below 670 would be bearish. |
| Not to be outdone, the Bollinger Bands are also contracting, and they are at their narrowest since the middle of 2003. Contracting Bollinger Bands indicates decreasing volatility, and this usually precedes a breakout -- like the quiet before a storm. As with the triangle and rectangle, the Bollinger Bands are neutral and a breakout is required for a directional bias. |
| Even though a break above 770 would not exceed the upper triangle trendline, it would break rectangle resistance and place silver near or above the upper Bollinger Band. Just as with the 2003 breakout (green oval), I would view a move above the upper band as a sign of strength and expect higher prices. Note how silver moved above the upper band and then hugged the upper back all the way to 850. |
Arthur Hill is currently editor of TDTrader.com, a website specializing in trading strategies, sector/industry specific breadth stats and overall technical analysis. He passed the Society of Technical Analysts (STA London) diploma exam with distinction is a Certified Financial Technician (CFTe). Prior to TD Trader, he was the Chief Technical Analyst for Stockcharts.com and the main contributor to the ChartSchool.
| Title: | Editor |
| Company: | TDTrader.com |
| Address: | Willem Geetsstraat 17 |
| Mechelen, B2800 | |
| Phone # for sales: | 3215345465 |
| Website: | www.tdtrader.com |
| E-mail address: | arthurh@tdtrader.com |
Traders' Resource Links | |
| TDTrader.com has not added any product or service information to TRADERS' RESOURCE. | |
Click here for more information about our publications!
Comments
Date: 10/04/05Rank: 4Comment:
Date: 10/21/05Rank: 4Comment:

Request Information From Our Sponsors
- StockCharts.com, Inc.
- Candle Patterns
- Candlestick Charting Explained
- Intermarket Technical Analysis
- John Murphy on Chart Analysis
- John Murphy's Chart Pattern Recognition
- John Murphy's Market Message
- MurphyExplainsMarketAnalysis-Intermarket Analysis
- MurphyExplainsMarketAnalysis-Visual Analysis
- StockCharts.com
- Technical Analysis of the Financial Markets
- The Visual Investor
- VectorVest, Inc.
- Executive Premier Workshop
- One-Day Options Course
- OptionsPro
- Retirement Income Workshop
- Sure-Fire Trading Systems (VectorVest, Inc.)
- Trading as a Business Workshop
- VectorVest 7 EOD
- VectorVest 7 RealTime/IntraDay
- VectorVest AutoTester
- VectorVest Educational Services
- VectorVest OnLine
- VectorVest Options Analyzer
- VectorVest ProGraphics v6.0
- VectorVest ProTrader 7
- VectorVest RealTime Derby Tool
- VectorVest Simulator
- VectorVest Variator
- VectorVest Watchdog
