HOT TOPICS LIST
- MACD
- Fibonacci
- RSI
- Gann
- ADXR
- Stochastics
- Volume
- Triangles
- Futures
- Cycles
- Volatility
- ZIGZAG
- MESA
- Retracement
- Aroon
INDICATORS LIST
LIST OF TOPICS
PRINT THIS ARTICLE
by Paolo Pezzutti
Volatility is at its lowest levels in years. Although structural changes might be ongoing, a high-volatility environment appears to be back.
Position: N/A
Paolo Pezzutti
Author of the book "Trading the US Markets - A Comprehensive Guide to US Markets for International Traders and Investors" - Harriman House (July 2008)
PRINT THIS ARTICLE
VOLATILITY
Stock Market Volatility: What Next?
10/03/05 12:49:55 PMby Paolo Pezzutti
Volatility is at its lowest levels in years. Although structural changes might be ongoing, a high-volatility environment appears to be back.
Position: N/A
| Usually, a market tends to move fast from periods of price consolidation to new levels of price equilibrium. Markets oscillate from periods of low volatility to high volatility and back again. After periods of extremely low volatility, volatility tends to increase and prices can move sharply. Stock markets are printing extremely low levels of volatility. What does it mean for investors? Historical volatility can be measured by the standard deviation of day-to-day logarithmic closing price changes, expressed as an annualized percentage. In simple terms, historical volatility is the degree to which prices fluctuate over a period -- for example, a 14-day historical volatility reading of 30% for a security trading at a price of $100 means that for the past 14 days, its annualized range would have been between $70 and $130 one standard deviation of the time. A high-volatility reading indicates that the security is very volatile, while a low-volatility reading notes the lack of volatility. |

|
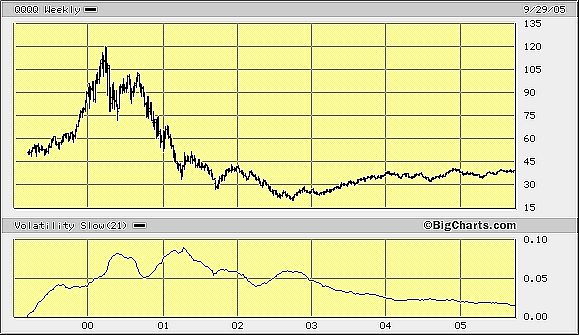
| FIGURE 1: QQQQ WEEKLY. The QQQQ weekly printed a declining volatility during the last three years' uptrend. Now it is at its lowest levels. |
| Graphic provided by: BigCharts.com. |
| |
| In Figure 1, you can see the weekly chart of QQQQ and the historical volatility plot. Note that volatility is at its lowest levels in six years. Since 2002, the decline of volatility has been precipitous. During the past three years, the markets have been recovering from the end of the 1990s bubble, printing an uptrend that in the case of QQQQ gave back partially the heavy losses suffered between 2000 and 2002. There are many theories about where volatility has gone. An interesting one, in my opinion, is related to the hedge funds growth in assets during the past five years and the strategies these funds use. On one hand, hedge funds assets almost doubled since 2002. On the other, several strategies can be considered volatility draining, including more than 40% of the total assets managed by the hedge funds. These strategies vary from long/short equity to equity market neutral, convertible arbitrage and so forth. They drain volatility because they trade both sides of the markets, with net positions very close to zero. |
| Whatever the reason, it is a common belief that low volatility will probably mean lower returns for the hedge funds, increasingly reduced margins, with the majority of funds selling volatility by doing market-neutral investments. According to the theory, volatility will remain low as long as hedge funds continue to grow. A low-volatility environment is also thought to be bad for traders, because the more a market moves, the more opportunity there is to profit from such a move. I would add, however, that you also increase your risks. A new array of methodologies is emerging, one that thrives on tighter ranges. It is very likely the classic volatility breakout systems are not performing as well as before. Traders had to adapt their systems to the new environment. |

|
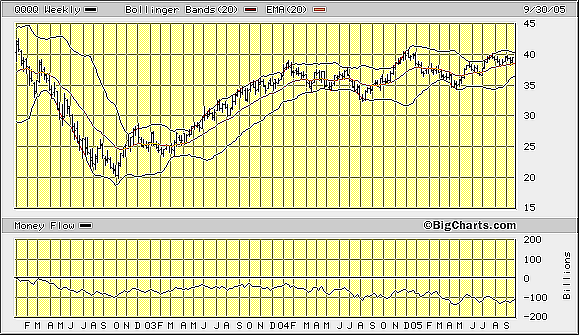
| FIGURE 2: MONEY FLOW. The QQQQ weekly chart displays how the money flow indicator remained negative during the uptrend. |
| Graphic provided by: BigCharts.com. |
| |
| My view on the market dynamics is that a directional impulse, most of the time, brings volatility in the direction of the trend. The top in the year 2000 was reached in a high-volatility environment. The crash that followed printed a spike in volatility in 2001. I interpret the last three years' movement as a reaction to the impulsive action to the downside, sustained by very low interest rates that provided liquidity to the market and help corporate profits. In Figure 2, you can see the uptrend on the QQQQ weekly chart that brought prices from the low at about $20 in October 2002 to the $40 level on December 2004. Note that the money flow indicator remained negative throughout the period, indicating the absence of accumulation in this market so far. |
| There might be an ongoing change in the market, providing a lower-volatility structure than in the past. However, I believe that a high-volatility environment is ahead of us. Trading range and reaction phases can be quite long, especially if you conduct your analysis at the weekly or monthly level. There is no doubt, however, that volatility is quite cyclical in its nature. At the moment, the market is not providing signs of increasing volatility, although it appears to be more "news driven" than in the past months. A sharp increase in volatility will require traders to change their approach in order not to get caught unprepared. |
Author of the book "Trading the US Markets - A Comprehensive Guide to US Markets for International Traders and Investors" - Harriman House (July 2008)
| Address: | VIA ROBERTO AGO 26 POSTAL CODE 00166 |
| Rome, ITALY | |
| Phone # for sales: | +393357540708 |
| E-mail address: | pezzutti.paolo@tiscali.it |
Click here for more information about our publications!
Comments
Date: 10/04/05Rank: 2Comment:
Date: 10/04/05Rank: 5Comment:
Date: 10/04/05Rank: 3Comment:
Date: 10/21/05Rank: 4Comment:

|

Request Information From Our Sponsors
- StockCharts.com, Inc.
- Candle Patterns
- Candlestick Charting Explained
- Intermarket Technical Analysis
- John Murphy on Chart Analysis
- John Murphy's Chart Pattern Recognition
- John Murphy's Market Message
- MurphyExplainsMarketAnalysis-Intermarket Analysis
- MurphyExplainsMarketAnalysis-Visual Analysis
- StockCharts.com
- Technical Analysis of the Financial Markets
- The Visual Investor
- VectorVest, Inc.
- Executive Premier Workshop
- One-Day Options Course
- OptionsPro
- Retirement Income Workshop
- Sure-Fire Trading Systems (VectorVest, Inc.)
- Trading as a Business Workshop
- VectorVest 7 EOD
- VectorVest 7 RealTime/IntraDay
- VectorVest AutoTester
- VectorVest Educational Services
- VectorVest OnLine
- VectorVest Options Analyzer
- VectorVest ProGraphics v6.0
- VectorVest ProTrader 7
- VectorVest RealTime Derby Tool
- VectorVest Simulator
- VectorVest Variator
- VectorVest Watchdog
