HOT TOPICS LIST
- MACD
- Fibonacci
- RSI
- Gann
- ADXR
- Stochastics
- Volume
- Triangles
- Futures
- Cycles
- Volatility
- ZIGZAG
- MESA
- Retracement
- Aroon
INDICATORS LIST
LIST OF TOPICS
PRINT THIS ARTICLE
by David Penn
Seen through the lens of two screens, the 10-year Treasury note looks as if it's headed lower--with a corresponding rally in yields.
Position: N/A
David Penn
Technical Writer for Technical Analysis of STOCKS & COMMODITIES magazine, Working-Money.com, and Traders.com Advantage.
PRINT THIS ARTICLE
OVERBOUGHT OVERSOLD
Another Rate Rally
10/03/05 07:59:41 AMby David Penn
Seen through the lens of two screens, the 10-year Treasury note looks as if it's headed lower--with a corresponding rally in yields.
Position: N/A
| With so much attention devoted to crude oil, gold, the dollar, and--of course--the stock market, the world of bonds has been somewhat overlooked. Save for the "housing remains strong" bromides from the MSM (mainstream media) and the occasional Congressional bleating about the federal budget deficit, talk of debt and how it is financed has been in relatively short supply in current conversations. |
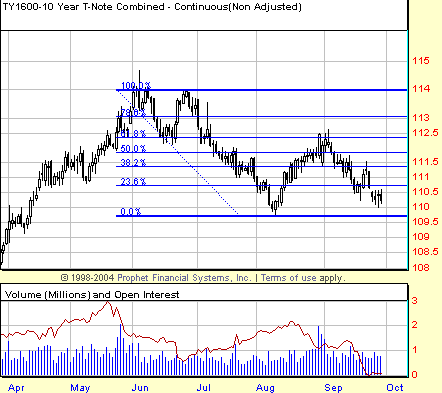
| But if it is always the squeaking wheel that gets the grease, the bond investors might want to prep themselves for more than a little chirping, creaking, and crying from the bond market. For after an August rally that saw the 10-year note retrace just a tad over 61.8% of its May to July correction, it appears that the 10-year note is once again back on the path downward (Figure 1). |

|
| FIGURE 1: 10-YEAR TREASURY. The bounce in August retraced about 61.8% of the previous correction before turning back down in September. |
| Graphic provided by: Prophet Financial, Inc. |
| |
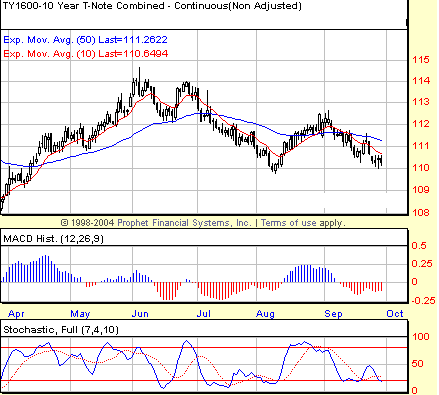
| Let's take a look at the breakdown in September through the lens of my "histochastic" screen, which uses the moving average convergence/divergence (MACD) histogram and the 7,10 stochastic. Ideally, a negative stochastic divergence at the top of the August rally would signify a top of at least intermediate-term significance (Figure 2). As for September, the histochastic screen should show a MACD histogram breakout to the downside once the 10-year note was below a major intermediate-term moving average such as the 50-day exponential moving average (EMA). |

|
| FIGURE 2: STOCHASTIC DIVERGENCE, MACD HISTOGRAM BREAKDOWN. A negative stochastic divergence in August and a MACD histogram breakdown in September paved the way for lower prices in the near term. |
| Graphic provided by: Prophet Financial, Inc. |
| |
| Both conditions were met. The stochastic made a negative divergence with price action in August, peaking early and edging lower, while the price of the 10-year note did the opposite (advancing early and peaking late). As for the MACD histogram breakdown, there are a number of ways to look at it. One popular method is simply to look for the MACD histogram to move from positive to negative territory. Another approach, however, suggests that if looking to short, wait for the MACD histogram to tick higher, then reverse itself back to the downside. In the former case, an entry near 111-07 on September 12 would have been suggested. In the latter case, an entry near 109-30 is where a bearish bond trader might make an offer. This is based on the MACD histogram reversal on September 23. My other favorite screen, BOSO, also suggests opportunity to the downside. BOSO, as I wrote recently for Working-Money.com, stands for "buying overbought and selling oversold" and is derived from some of the insights of Price Headley of BigTrends.com. See my Working-Money.com article for more on BOSO, but suffice it here to say that the screen follows legendary trader Jesse Livermore's famous dictum that it is "never too high to buy and never too low to sell." |

|
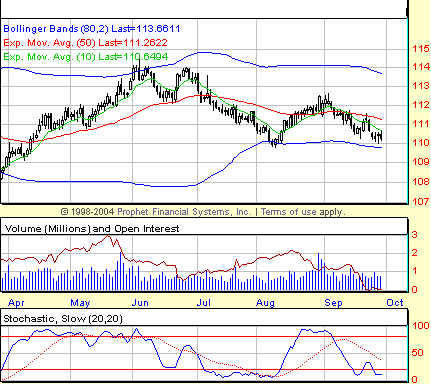
| FIGURE 3: BOSO. The initial BOSO short opportunity arrived in the first half of July. Now a second BOSO short suggests itself in late September. |
| Graphic provided by: Prophet Financial, Inc. |
| |
| Put most simply, the BOSO screen suggests that assets are buyable when they show follow-through after becoming overbought as measured by a stochastic oscillator reading over 80. Similarly, assets are shortable when they show follow-through to the downside after becoming oversold by virtue of a stochastic oscillator that is below 20. In Figure 3, note what happens as the 10-year T-note--basis continuous futures--enters oversold territory in early July. Becoming oversold at 112-13, the 10-year is at 110-20 when it emerges from oversold territory. At one point, the 10-year is as low as 109-30. In late September, the 10-year note looked primed for another BOSO opportunity as the stochastic slipped back into oversold territory. The initial dip below 20 at mid-month was a bit of a feint, insofar as there was no follow-through to the downside. However the second move below 20 in the stochastic a few days later clearly had downside follow-through, and moreover, it represented a short signal that is very much compatible with those produced by the histochastic screen. |
Technical Writer for Technical Analysis of STOCKS & COMMODITIES magazine, Working-Money.com, and Traders.com Advantage.
| Title: | Technical Writer |
| Company: | Technical Analysis, Inc. |
| Address: | 4757 California Avenue SW |
| Seattle, WA 98116 | |
| Phone # for sales: | 206 938 0570 |
| Fax: | 206 938 1307 |
| Website: | www.Traders.com |
| E-mail address: | DPenn@traders.com |
Traders' Resource Links | |
| Charting the Stock Market: The Wyckoff Method -- Books | |
| Working-Money.com -- Online Trading Services | |
| Traders.com Advantage -- Online Trading Services | |
| Technical Analysis of Stocks & Commodities -- Publications and Newsletters | |
| Working Money, at Working-Money.com -- Publications and Newsletters | |
| Traders.com Advantage -- Publications and Newsletters | |
| Professional Traders Starter Kit -- Software | |
Click here for more information about our publications!
Comments
Date: 10/04/05Rank: 3Comment:
Date: 10/21/05Rank: 2Comment:

Request Information From Our Sponsors
- VectorVest, Inc.
- Executive Premier Workshop
- One-Day Options Course
- OptionsPro
- Retirement Income Workshop
- Sure-Fire Trading Systems (VectorVest, Inc.)
- Trading as a Business Workshop
- VectorVest 7 EOD
- VectorVest 7 RealTime/IntraDay
- VectorVest AutoTester
- VectorVest Educational Services
- VectorVest OnLine
- VectorVest Options Analyzer
- VectorVest ProGraphics v6.0
- VectorVest ProTrader 7
- VectorVest RealTime Derby Tool
- VectorVest Simulator
- VectorVest Variator
- VectorVest Watchdog
- StockCharts.com, Inc.
- Candle Patterns
- Candlestick Charting Explained
- Intermarket Technical Analysis
- John Murphy on Chart Analysis
- John Murphy's Chart Pattern Recognition
- John Murphy's Market Message
- MurphyExplainsMarketAnalysis-Intermarket Analysis
- MurphyExplainsMarketAnalysis-Visual Analysis
- StockCharts.com
- Technical Analysis of the Financial Markets
- The Visual Investor
