HOT TOPICS LIST
- MACD
- Fibonacci
- RSI
- Gann
- ADXR
- Stochastics
- Volume
- Triangles
- Futures
- Cycles
- Volatility
- ZIGZAG
- MESA
- Retracement
- Aroon
INDICATORS LIST
LIST OF TOPICS
PRINT THIS ARTICLE
by Gary Grosschadl
This resort developer broke ground today for Oahu's first new beachfront condominium homes in more than two decades. A traditional Hawaiian blessing and this chart may indicate brighter things ahead after this recent downturn.
Position: Buy
Gary Grosschadl
Independent Canadian equities trader and technical analyst based in Peterborough
Ontario, Canada.
PRINT THIS ARTICLE
CHART ANALYSIS
Centex Corp. Looking To Bounce
09/30/05 01:43:27 PMby Gary Grosschadl
This resort developer broke ground today for Oahu's first new beachfront condominium homes in more than two decades. A traditional Hawaiian blessing and this chart may indicate brighter things ahead after this recent downturn.
Position: Buy
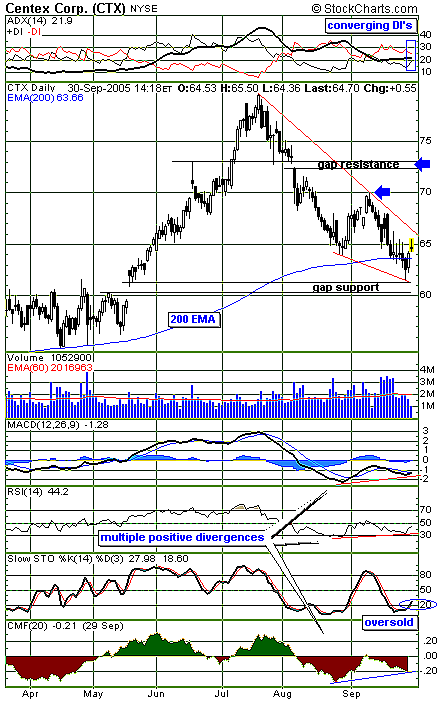
| This daily chart of Centex (Figure 1) shows a sizable two-month correction giving this stock a haircut from $79 to $61. This correction touched two significant milestones: a bounce off previous gap support and a somewhat sloppy bounce off the ever-important 200-day exponential moving average (EMA). |
| To make the argument more convincing that a bounce is likely, several indicators seem to give their own blessings. At the top of the chart, the directional movement index shows converging DIs (directional indicators). Should this lead to an actual cross, then the bulls will have the upper hand concerning bullish power (+DI) rising above bearish power (-DI). |

|
| FIGURE 1: CENTEX DAILY CHART. The daily chart shows the possibility of a bounce attempt. |
| Graphic provided by: StockCharts.com. |
| |
| Three indicators below the chart show positive divergences to price action. When a stock makes newer lows but major indicators do not confirm, then a bounce is often being set up. The moving average convergence/divergence (MACD), the relative strength index (RSI), and the Chaikin money flow (CMF) all show this positive divergence. Note the stochastic oscillator shows a move above oversold levels that could signal another stochastic upleg. |
| To break this downtrend, the stock must first close above the upper trendline at $66. Then two upside targets come into view. The $70 area represents a previous congestion zone that could pause the stock or reverse a weak attempt. The next possible target could be the previous gap at ~ $73. Note how this also relates two significant candlesticks (a tall bullish candle and a long upper shadow). |
| The stock has a chance to bounce here, but should it make a surprise move below the 200-day EMA again, then all bullish bets are off and the Hawaiian luau is put on hold. |
Independent Canadian equities trader and technical analyst based in Peterborough
Ontario, Canada.
| Website: | www.whatsonsale.ca/financial.html |
| E-mail address: | gwg7@sympatico.ca |
Click here for more information about our publications!
Comments
Date: 10/04/05Rank: 5Comment:

Request Information From Our Sponsors
- StockCharts.com, Inc.
- Candle Patterns
- Candlestick Charting Explained
- Intermarket Technical Analysis
- John Murphy on Chart Analysis
- John Murphy's Chart Pattern Recognition
- John Murphy's Market Message
- MurphyExplainsMarketAnalysis-Intermarket Analysis
- MurphyExplainsMarketAnalysis-Visual Analysis
- StockCharts.com
- Technical Analysis of the Financial Markets
- The Visual Investor
- VectorVest, Inc.
- Executive Premier Workshop
- One-Day Options Course
- OptionsPro
- Retirement Income Workshop
- Sure-Fire Trading Systems (VectorVest, Inc.)
- Trading as a Business Workshop
- VectorVest 7 EOD
- VectorVest 7 RealTime/IntraDay
- VectorVest AutoTester
- VectorVest Educational Services
- VectorVest OnLine
- VectorVest Options Analyzer
- VectorVest ProGraphics v6.0
- VectorVest ProTrader 7
- VectorVest RealTime Derby Tool
- VectorVest Simulator
- VectorVest Variator
- VectorVest Watchdog
