HOT TOPICS LIST
- MACD
- Fibonacci
- RSI
- Gann
- ADXR
- Stochastics
- Volume
- Triangles
- Futures
- Cycles
- Volatility
- ZIGZAG
- MESA
- Retracement
- Aroon
INDICATORS LIST
LIST OF TOPICS
PRINT THIS ARTICLE
by David Penn
A higher low follows a lower high in the S&P 500 ... could a triangle send the market higher?
Position: N/A
David Penn
Technical Writer for Technical Analysis of STOCKS & COMMODITIES magazine, Working-Money.com, and Traders.com Advantage.
PRINT THIS ARTICLE
TRIANGLES
The Case For Higher Prices
09/30/05 02:25:02 PMby David Penn
A higher low follows a lower high in the S&P 500 ... could a triangle send the market higher?
Position: N/A
| I started off the day writing about a bear flag in the sideways price action in the Standard & Poor's 500 in recent days. About halfway through that dissertation, the S&P 500 exploded to the upside, turning a relatively flat session into a wildly bullish one. |
| While volume was not outstanding on the 10-point-plus session in the S&P 500, price does not lie--as those who scrambled to cover their short positions around midday can attest. It is important to note if the resolution to a string of doji-like days is to the upside, then traders who wait too long for upside follow-through could find themselves paying higher prices than they may want. |

|
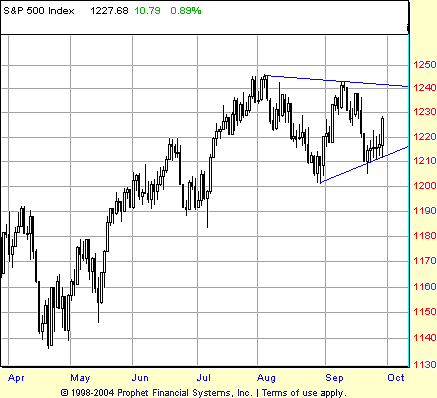
| FIGURE 1: TRIANGLES. Lower highs and lower lows often result in triangular consolidations. |
| Graphic provided by: Prophet Financial, Inc. |
| |
| It is way, way too early to fix a pattern on the price action since August. I had initially considered the August highs to represent a significant top--and had maintained that view through the lower highs in September. But the price action today, which among other things created a higher low vis-a-vis the August lows, has given me more than a little reason for pause. And the shape of that pause is triangular (Figure 1). What would it take for a symmetrical triangle to develop in the S&P 500 in the autumn? Right now, if the symmetrical triangle pattern is actually developing, there have been three touches against the converging trendlines that provide boundaries for the pattern. Those touches are in late August, early September, and late September. Ideally, there would be two more: another touch to the upside as the late September bounce shows some measure of follow-through, and a final touch to the downside that creates a second higher low vis-a-vis the late August lows. |
| Again, I want to emphasize that this is early speculation. Markets sometimes don't break out even from completed triangles, let alone potential triangles potentially in progress. But I wanted to present this case for higher prices because the market has seemed so set up for lower prices for so long (at least since August), it seems to make sense to me to at least be prepared for bullish scenarios that may appear to come from nowhere, but in reality were simply lurking behind an excessively bearish overview. |

|
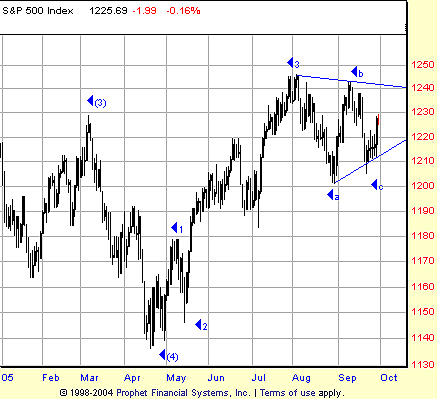
| FIGURE 2: BREAKOUT. This alternative wave count suggests that the market might have more upside in the wake of a successful breakout from a work-in-progress symmetrical triangle. |
| Graphic provided by: Prophet Financial, Inc. |
| |
| For those following the wave counts I've provided, consider Figure 2 to represent my current "alternative count" in the event the market breaks out to new highs. That "alternative count" includes the possibility of the triangle mentioned here. |
Technical Writer for Technical Analysis of STOCKS & COMMODITIES magazine, Working-Money.com, and Traders.com Advantage.
| Title: | Technical Writer |
| Company: | Technical Analysis, Inc. |
| Address: | 4757 California Avenue SW |
| Seattle, WA 98116 | |
| Phone # for sales: | 206 938 0570 |
| Fax: | 206 938 1307 |
| Website: | www.Traders.com |
| E-mail address: | DPenn@traders.com |
Traders' Resource Links | |
| Charting the Stock Market: The Wyckoff Method -- Books | |
| Working-Money.com -- Online Trading Services | |
| Traders.com Advantage -- Online Trading Services | |
| Technical Analysis of Stocks & Commodities -- Publications and Newsletters | |
| Working Money, at Working-Money.com -- Publications and Newsletters | |
| Traders.com Advantage -- Publications and Newsletters | |
| Professional Traders Starter Kit -- Software | |
Click here for more information about our publications!
Comments
Date: 10/04/05Rank: 4Comment:
Date: 10/04/05Rank: 4Comment:
Date: 10/21/05Rank: 3Comment:

Request Information From Our Sponsors
- StockCharts.com, Inc.
- Candle Patterns
- Candlestick Charting Explained
- Intermarket Technical Analysis
- John Murphy on Chart Analysis
- John Murphy's Chart Pattern Recognition
- John Murphy's Market Message
- MurphyExplainsMarketAnalysis-Intermarket Analysis
- MurphyExplainsMarketAnalysis-Visual Analysis
- StockCharts.com
- Technical Analysis of the Financial Markets
- The Visual Investor
- VectorVest, Inc.
- Executive Premier Workshop
- One-Day Options Course
- OptionsPro
- Retirement Income Workshop
- Sure-Fire Trading Systems (VectorVest, Inc.)
- Trading as a Business Workshop
- VectorVest 7 EOD
- VectorVest 7 RealTime/IntraDay
- VectorVest AutoTester
- VectorVest Educational Services
- VectorVest OnLine
- VectorVest Options Analyzer
- VectorVest ProGraphics v6.0
- VectorVest ProTrader 7
- VectorVest RealTime Derby Tool
- VectorVest Simulator
- VectorVest Variator
- VectorVest Watchdog
