HOT TOPICS LIST
- MACD
- Fibonacci
- RSI
- Gann
- ADXR
- Stochastics
- Volume
- Triangles
- Futures
- Cycles
- Volatility
- ZIGZAG
- MESA
- Retracement
- Aroon
INDICATORS LIST
LIST OF TOPICS
PRINT THIS ARTICLE
by Koos van der Merwe
In my September 22nd article, "Analyzing The S&P 500 Index Using Gann," I concluded that the index is due for a major correction, and that the US economy will inevitably collapse. It is simply waiting for a trigger to set it off. Figures 1 through 4 show another method of looking for that inevitable collapse.
Position: Sell
Koos van der Merwe
Has been a technical analyst since 1969, and has worked as a futures and options trader with First Financial Futures in Johannesburg, South Africa.
PRINT THIS ARTICLE
ELLIOTT WAVE
Value Line Arithmetic And Geometric Indexes
09/29/05 12:57:58 PMby Koos van der Merwe
In my September 22nd article, "Analyzing The S&P 500 Index Using Gann," I concluded that the index is due for a major correction, and that the US economy will inevitably collapse. It is simply waiting for a trigger to set it off. Figures 1 through 4 show another method of looking for that inevitable collapse.
Position: Sell
| The Value Line Arithmetic Composite Index and Value Line Geometric Composite Index are an equally weighted price index of all stocks covered in the Value Line Investment Survey. Arithmetic refers to the averaging technique used to compute the average, while geometric refers to a semilogarithmic average of the arithmetic index. |

|
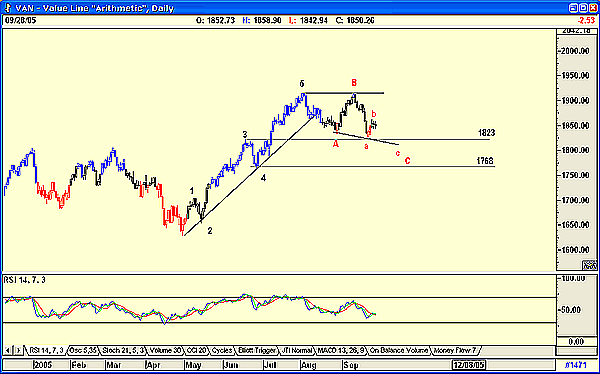
| FIGURE 1: VALUE LINE DAILY ARITHMETIC CHART. This chart shows that a minor Elliott impulse wave has completed or could be completing an ABC move down. |
| Graphic provided by: AdvancedGET. |
| |
| Figure 1 is a daily chart of the arithmetic index. The chart shows that a minor Elliott impulse wave has been completed or could be completing an ABC move down. I have written "could be" completing, because a correction should end within the fourth wave of lesser degree, and it has not. In addition, remember that C-waves are usually five-impulse waves down, but they can be a simple a-b-c wave on occasion. With the fourth wave of lesser degree between 1768 and 1823, and the relative strength index (RSI) still suggesting weakness, I believe that there will be further downside. |

|
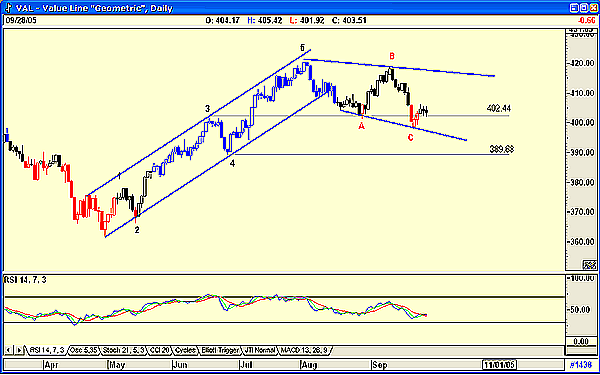
| FIGURE 2: VALUE LINE GEOMETRIC DAILY CHART. In contrast to Figure 1, this chart shows that that area of the fourth wave of lesser degree has been breached, and an upmove should now be in progress. |
| Graphic provided by: AdvancedGET. |
| |
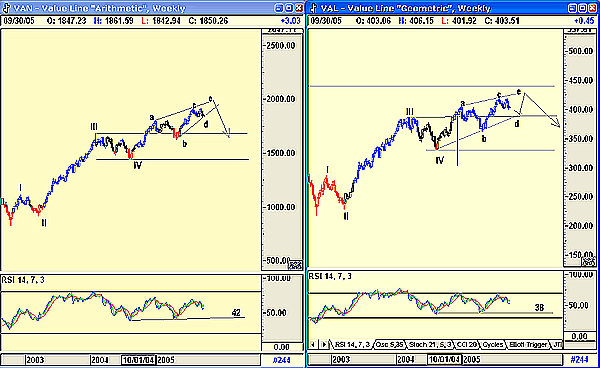
| On the other hand, Figure 2, the geometric chart, shows that the area of the fourth wave of lesser degree has been breached, and that an upmove should now be in progress. Is this a genuine count? Will the next move up also be a five-wave count, or is the ABC correction not complete, as suggested by the RSI, which is still suggesting further weakness? So in order to find further clarity, we look at a weekly chart (Figure 3). The weekly chart shows both the arithmetric and geometric charts. Both Figures 1 and 2 suggest that the fifth wave upward could be a pennant, culminating in "e" before a fall to the level of the fourth wave of lesser degree. In both charts, the RSI is also suggesting that it did not fall below the 30 level before giving a buy signal--a further sign that a pennant is forming, and that the downtrend is still in place. |

|
| FIGURE 3: VALUE LINE WEEKLY CHARTS. Here are both the arithmetic and geometric charts. Both charts suggest that the fifth wave upward could be a pennant. |
| Graphic provided by: AdvancedGET. |
| |
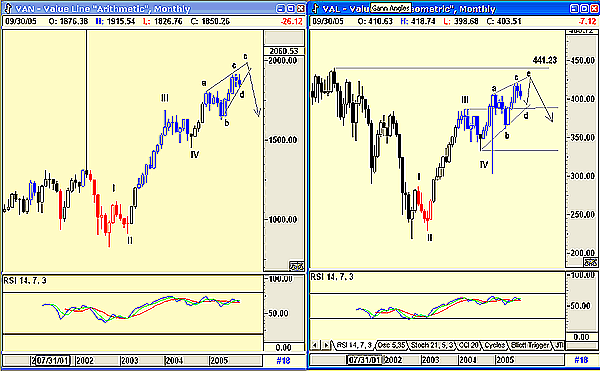
| Finally, we look at the monthly chart (Figure 4). Here we see that the pennant theory is probably correct, but we also see that with the geometric chart, a double top looks imminent at 441.23. This is confirmed by the RSI, which in the geometric chart is trending upward. |

|
| FIGURE 4: VALUE LINE MONTHLY CHARTS. A double top appears to be imminent. |
| Graphic provided by: AdvancedGET. |
| |
| From these charts, I must therefore conclude that there is still some upside left... but not for that much longer. Let us hope that October blues will not be the top of wave "e" and wave 5, or if it is, be prepared to take advantage of it by selling before the Value Line indicators peak and buying back at the trough. |
Has been a technical analyst since 1969, and has worked as a futures and options trader with First Financial Futures in Johannesburg, South Africa.
| Address: | 3256 West 24th Ave |
| Vancouver, BC | |
| Phone # for sales: | 6042634214 |
| E-mail address: | petroosp@gmail.com |
Click here for more information about our publications!
Comments
Date: 10/04/05Rank: 4Comment:
Date: 10/21/05Rank: 3Comment:

Request Information From Our Sponsors
- StockCharts.com, Inc.
- Candle Patterns
- Candlestick Charting Explained
- Intermarket Technical Analysis
- John Murphy on Chart Analysis
- John Murphy's Chart Pattern Recognition
- John Murphy's Market Message
- MurphyExplainsMarketAnalysis-Intermarket Analysis
- MurphyExplainsMarketAnalysis-Visual Analysis
- StockCharts.com
- Technical Analysis of the Financial Markets
- The Visual Investor
- VectorVest, Inc.
- Executive Premier Workshop
- One-Day Options Course
- OptionsPro
- Retirement Income Workshop
- Sure-Fire Trading Systems (VectorVest, Inc.)
- Trading as a Business Workshop
- VectorVest 7 EOD
- VectorVest 7 RealTime/IntraDay
- VectorVest AutoTester
- VectorVest Educational Services
- VectorVest OnLine
- VectorVest Options Analyzer
- VectorVest ProGraphics v6.0
- VectorVest ProTrader 7
- VectorVest RealTime Derby Tool
- VectorVest Simulator
- VectorVest Variator
- VectorVest Watchdog
