HOT TOPICS LIST
- MACD
- Fibonacci
- RSI
- Gann
- ADXR
- Stochastics
- Volume
- Triangles
- Futures
- Cycles
- Volatility
- ZIGZAG
- MESA
- Retracement
- Aroon
INDICATORS LIST
LIST OF TOPICS
PRINT THIS ARTICLE
by Arthur Hill
US Steel gapped down on September 20, and this gap should be considered bearish unless it is filled.
Position: Sell
Arthur Hill
Arthur Hill is currently editor of TDTrader.com, a website specializing in trading strategies, sector/industry specific breadth stats and overall technical analysis. He passed the Society of Technical Analysts (STA London) diploma exam with distinction is a Certified Financial Technician (CFTe). Prior to TD Trader, he was the Chief Technical Analyst for Stockcharts.com and the main contributor to the ChartSchool.
PRINT THIS ARTICLE
GAPS
US Steel Cannot Recover After Gap
09/28/05 08:52:31 AMby Arthur Hill
US Steel gapped down on September 20, and this gap should be considered bearish unless it is filled.
Position: Sell
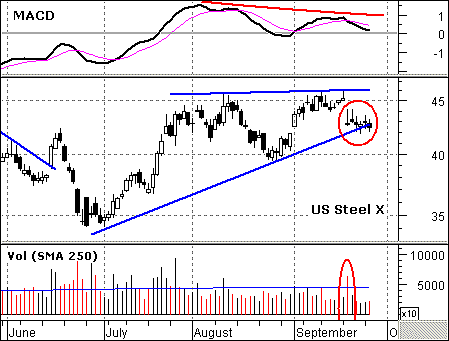
| Before looking at the gap, let's look at the overall price chart (Figure 1). The stock advanced from 34 to 46 over the last three months and met resistance around 46 in August and September. Technically, a higher high formed in September and the overall pattern looks like a rising wedge. Last week's sharp drop carried the stock to trendline support and it is now consolidating (red circle). A move below the trendline would be negative. |

|
| FIGURE 1: X. US Steel has advanced over the last three months and met resistance in August and September. |
| Graphic provided by: MetaStock. |
| Graphic provided by: Reuters Data. |
| |
| Last week's sharp decline featured a gap on high volume (red oval), and high volume validates the gap. After the gap, the stock formed six indecisive candlesticks with small bodies and low volume. The range has been rather tight as the stock consolidates. A move below 42 would signal a continuation lower, while a move above 45 would fill the gap and revive the bulls. For now, the gap is the dominant chart feature and it is bearish until proven otherwise (filled). |
| Momentum is waning as the moving average convergence/divergence (MACD) formed a negative divergence and is poised to turn negative. As the stock moved to a higher high in September, MACD failed to follow suit and formed a lower high. This is a negative divergence and shows that momentum is not keeping pace with the stock. However, momentum has yet to actually turn negative and a move below zero would be the final bear signal for MACD. |
Arthur Hill is currently editor of TDTrader.com, a website specializing in trading strategies, sector/industry specific breadth stats and overall technical analysis. He passed the Society of Technical Analysts (STA London) diploma exam with distinction is a Certified Financial Technician (CFTe). Prior to TD Trader, he was the Chief Technical Analyst for Stockcharts.com and the main contributor to the ChartSchool.
| Title: | Editor |
| Company: | TDTrader.com |
| Address: | Willem Geetsstraat 17 |
| Mechelen, B2800 | |
| Phone # for sales: | 3215345465 |
| Website: | www.tdtrader.com |
| E-mail address: | arthurh@tdtrader.com |
Traders' Resource Links | |
| TDTrader.com has not added any product or service information to TRADERS' RESOURCE. | |
Click here for more information about our publications!
Comments
Date: 09/28/05Rank: 4Comment:

Request Information From Our Sponsors
- StockCharts.com, Inc.
- Candle Patterns
- Candlestick Charting Explained
- Intermarket Technical Analysis
- John Murphy on Chart Analysis
- John Murphy's Chart Pattern Recognition
- John Murphy's Market Message
- MurphyExplainsMarketAnalysis-Intermarket Analysis
- MurphyExplainsMarketAnalysis-Visual Analysis
- StockCharts.com
- Technical Analysis of the Financial Markets
- The Visual Investor
- VectorVest, Inc.
- Executive Premier Workshop
- One-Day Options Course
- OptionsPro
- Retirement Income Workshop
- Sure-Fire Trading Systems (VectorVest, Inc.)
- Trading as a Business Workshop
- VectorVest 7 EOD
- VectorVest 7 RealTime/IntraDay
- VectorVest AutoTester
- VectorVest Educational Services
- VectorVest OnLine
- VectorVest Options Analyzer
- VectorVest ProGraphics v6.0
- VectorVest ProTrader 7
- VectorVest RealTime Derby Tool
- VectorVest Simulator
- VectorVest Variator
- VectorVest Watchdog
