HOT TOPICS LIST
- MACD
- Fibonacci
- RSI
- Gann
- ADXR
- Stochastics
- Volume
- Triangles
- Futures
- Cycles
- Volatility
- ZIGZAG
- MESA
- Retracement
- Aroon
INDICATORS LIST
LIST OF TOPICS
PRINT THIS ARTICLE
by Arthur Hill
Palladium has been lagging gold lately, and the resolution of the current consolidation holds the key to the future.
Position: Accumulate
Arthur Hill
Arthur Hill is currently editor of TDTrader.com, a website specializing in trading strategies, sector/industry specific breadth stats and overall technical analysis. He passed the Society of Technical Analysts (STA London) diploma exam with distinction is a Certified Financial Technician (CFTe). Prior to TD Trader, he was the Chief Technical Analyst for Stockcharts.com and the main contributor to the ChartSchool.
PRINT THIS ARTICLE
BOLLINGER BANDS
Bollinger Bands Narrow On Palladium
09/27/05 01:21:23 PMby Arthur Hill
Palladium has been lagging gold lately, and the resolution of the current consolidation holds the key to the future.
Position: Accumulate
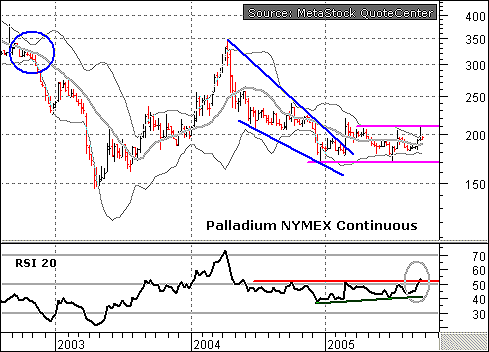
| On the weekly price chart (Figure 1), Palladium has consolidated between 170 and 220 in 2005. Trading has slowed to a crawl and the Bollinger Bands are at their narrowest since November 2002 (blue circle). Such contractions in volatility usually precede a significant move. However, Bollinger Band contractions do not offer any clues on the direction of the next move. |

|
| FIGURE 1: PALLADIUM. Trading has slowed to a crawl in 2005 and the Bollinger Bands are at their narrowest since November 2002. |
| Graphic provided by: MetaStock. |
| Graphic provided by: MetaStock QuoteCenter. |
| |
| For directional clues, I will turn to the price chart. Palladium broke falling wedge resistance with a surge in March 2005, but there was no follow-through. Instead, resistance at 210 held and the trading range extended. A break above 210 would forge a multimonth high and be bullish. This would call for a continuation of the 2003-04 advance and project a move above 350. Conversely, a failure at 210 and a break below support at 170 would be bearish and call for a support test around 150. |
| For an even earlier clue on the breakout, I am turning to the 20-period relative srength index (RSI). This momentum indicator has been working its way higher throughout the year (green trendline) and recently broke to a 52-week high (gray oval). In addition, RSI moved above 50 and momentum is starting to favor the bulls. This also favors an upside breakout. Failure to hold 50 and a move below 40 would be bearish. |
Arthur Hill is currently editor of TDTrader.com, a website specializing in trading strategies, sector/industry specific breadth stats and overall technical analysis. He passed the Society of Technical Analysts (STA London) diploma exam with distinction is a Certified Financial Technician (CFTe). Prior to TD Trader, he was the Chief Technical Analyst for Stockcharts.com and the main contributor to the ChartSchool.
| Title: | Editor |
| Company: | TDTrader.com |
| Address: | Willem Geetsstraat 17 |
| Mechelen, B2800 | |
| Phone # for sales: | 3215345465 |
| Website: | www.tdtrader.com |
| E-mail address: | arthurh@tdtrader.com |
Traders' Resource Links | |
| TDTrader.com has not added any product or service information to TRADERS' RESOURCE. | |
Click here for more information about our publications!
Comments
Date: 09/28/05Rank: 4Comment:

Request Information From Our Sponsors
- VectorVest, Inc.
- Executive Premier Workshop
- One-Day Options Course
- OptionsPro
- Retirement Income Workshop
- Sure-Fire Trading Systems (VectorVest, Inc.)
- Trading as a Business Workshop
- VectorVest 7 EOD
- VectorVest 7 RealTime/IntraDay
- VectorVest AutoTester
- VectorVest Educational Services
- VectorVest OnLine
- VectorVest Options Analyzer
- VectorVest ProGraphics v6.0
- VectorVest ProTrader 7
- VectorVest RealTime Derby Tool
- VectorVest Simulator
- VectorVest Variator
- VectorVest Watchdog
- StockCharts.com, Inc.
- Candle Patterns
- Candlestick Charting Explained
- Intermarket Technical Analysis
- John Murphy on Chart Analysis
- John Murphy's Chart Pattern Recognition
- John Murphy's Market Message
- MurphyExplainsMarketAnalysis-Intermarket Analysis
- MurphyExplainsMarketAnalysis-Visual Analysis
- StockCharts.com
- Technical Analysis of the Financial Markets
- The Visual Investor
