HOT TOPICS LIST
- MACD
- Fibonacci
- RSI
- Gann
- ADXR
- Stochastics
- Volume
- Triangles
- Futures
- Cycles
- Volatility
- ZIGZAG
- MESA
- Retracement
- Aroon
INDICATORS LIST
LIST OF TOPICS
PRINT THIS ARTICLE
by Jayanthi Gopalakrishnan
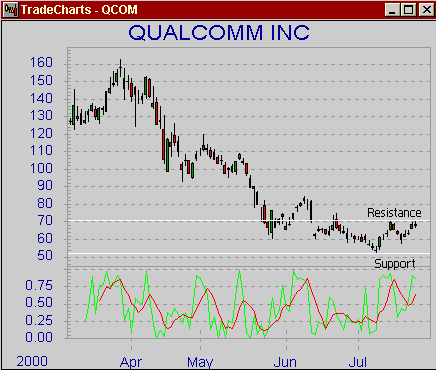
It is evident from the chart of Qualcomm, Inc. [QCOM] that after going through a sharp decline, the stock is in a consolidation range. This suggests that the stock is fluctuating between its support and resistance levels as displayed on the chart.
Position: N/A
Jayanthi Gopalakrishnan
PRINT THIS ARTICLE
A Stock For Your Watchlist
07/27/00 09:24:11 AMby Jayanthi Gopalakrishnan
It is evident from the chart of Qualcomm, Inc. [QCOM] that after going through a sharp decline, the stock is in a consolidation range. This suggests that the stock is fluctuating between its support and resistance levels as displayed on the chart.
Position: N/A
| Under such a scenario, the most effective indicator to use is an oscillator which identifies tops and bottoms, making it easier to anticipate reversals. One such oscillator is the stochastic oscillator. |
| The stochastic oscillator identifies areas of overbought and oversold territories. When the oscillator is at the 80 level, it suggests the security is overbought whereas if it is at the 20 level it indicates it is oversold. Further, a crossing of the fast line (green) above the slower line (red) generates a buy signal whereas a crossing of the fast (green) line below the slow (red) generates a sell. |

|
| Is Qualcomm, Inc. [QCOM] going to break out of its trading range? The upper half of the chart shows QCOM's daily price range for the past four months, and the lower half shows the corresponding fast (green) and slower (red) stochastic lines. |
| Graphic provided by: Tradecast Securities, Inc.. |
| |
| From the chart you can see that QCOM has hit its resistance level. Does this mean that the stock is ready to head south? There is no way to tell but it's important to monitor the chart to anticipate price direction. The fast stochastic line has not crossed below the slower one. Only when this crossing takes place will you be able to determine if it's a sell signal. |
| Keep in mind that you are dealing with the stock market where changes take place rapidly. Prices may move in a direction that you had not anticipated. If you decide to enter a short position when the faster stochastic line crosses the slower one, place a stop loss order just in case prices reverse. Prepare yourself to trade if prices look like they may break out of the trading range. This means you will have to apply different indicators to generate appropriate buy and sell signals. |
| Title: | Editor |
| Company: | Technical Analysis of Stocks & Commodities |
| Address: | 4757 California Ave SW |
| Seattle, WA 98116 | |
| Website: | Traders.com |
| E-mail address: | Jayanthi@traders.com |
Traders' Resource Links | |
| Charting the Stock Market: The Wyckoff Method -- Books | |
| Working-Money.com -- Online Trading Services | |
| Traders.com Advantage -- Online Trading Services | |
| Technical Analysis of Stocks & Commodities -- Publications and Newsletters | |
| Working Money, at Working-Money.com -- Publications and Newsletters | |
| Traders.com Advantage -- Publications and Newsletters | |
| Professional Traders Starter Kit -- Software | |
Click here for more information about our publications!
Comments

Request Information From Our Sponsors
- StockCharts.com, Inc.
- Candle Patterns
- Candlestick Charting Explained
- Intermarket Technical Analysis
- John Murphy on Chart Analysis
- John Murphy's Chart Pattern Recognition
- John Murphy's Market Message
- MurphyExplainsMarketAnalysis-Intermarket Analysis
- MurphyExplainsMarketAnalysis-Visual Analysis
- StockCharts.com
- Technical Analysis of the Financial Markets
- The Visual Investor
- VectorVest, Inc.
- Executive Premier Workshop
- One-Day Options Course
- OptionsPro
- Retirement Income Workshop
- Sure-Fire Trading Systems (VectorVest, Inc.)
- Trading as a Business Workshop
- VectorVest 7 EOD
- VectorVest 7 RealTime/IntraDay
- VectorVest AutoTester
- VectorVest Educational Services
- VectorVest OnLine
- VectorVest Options Analyzer
- VectorVest ProGraphics v6.0
- VectorVest ProTrader 7
- VectorVest RealTime Derby Tool
- VectorVest Simulator
- VectorVest Variator
- VectorVest Watchdog
