HOT TOPICS LIST
- MACD
- Fibonacci
- RSI
- Gann
- ADXR
- Stochastics
- Volume
- Triangles
- Futures
- Cycles
- Volatility
- ZIGZAG
- MESA
- Retracement
- Aroon
INDICATORS LIST
LIST OF TOPICS
PRINT THIS ARTICLE
by David Penn
Positive divergences in the MACD histogram and the stochastic suggest limited downside for the US dollar.
Position: N/A
David Penn
Technical Writer for Technical Analysis of STOCKS & COMMODITIES magazine, Working-Money.com, and Traders.com Advantage.
PRINT THIS ARTICLE
OVERBOUGHT OVERSOLD
Are The Dollar Bears Done?
09/27/05 10:43:51 AMby David Penn
Positive divergences in the MACD histogram and the stochastic suggest limited downside for the US dollar.
Position: N/A
| You'd never know it to see the moves that gold has made in recent days. But technical evidence is building that suggests the downtrend in the dollar might have run its course--a possibility that has significant implications for a number of other assets, including the euro and gold. |
| Because both the euro and gold can appreciate (or depreciate) against a variety of assets other than the dollar, I don't want to focus on any implications this dollar analysis may or may not have for those others. By some measures, the move in the dollar--or the potential move, if you prefer--should be significant enough to keep traders and speculators occupied, regardless of if or how the euro and gold move. |

|
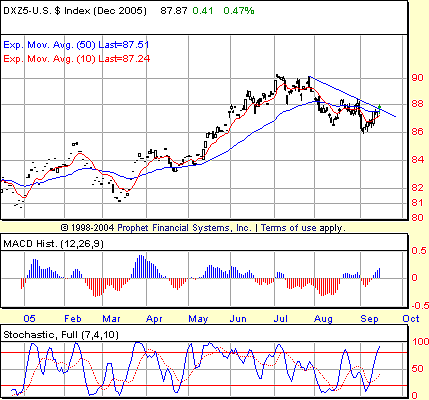
| FIGURE 1: US DOLLAR INDEX. Moving downward in a jagged correction, the December greenback finds support at a level--86--that once provided resistance. |
| Graphic provided by: Prophet Financial, Inc. |
| |
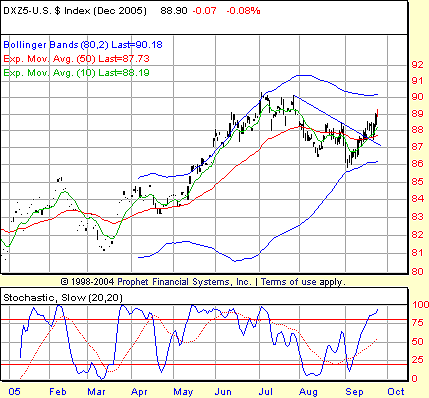
| The most bullish indications for the December US dollar come from the MACD histogram and the 7,10 stochastic (Figure 1). Note how both the MACD histogram and the 7,10 stochastic made higher troughs in early September compared with early August. This occurred at the same time that price action made a lower trough in September compared with early August. This is a classic example of a positive divergence. This divergence suggests that, at a minimum, prices will not likely move much lower. Instead, more likely are higher prices. Another technical portrait reveals similarly bullish possibilities for the recently declining December greenback. The studies in Figure 2 are derived from the work of Price Headley of BigTrends.com, who discussed these methods in a seminar at the Chicago Trader's Expo this past summer. Essentially, this study set includes an extra-long duration Bollinger Band (80 periods instead of the standard 20) and a basic stochastic. I include a few moving averages. What makes this study set worthwhile is that it appears especially effective at catching markets that seem to be already oversold or overbought. This idea is so central for me that I've nicknamed the study set "BOSO," for "buying overbought and selling oversold." The BOSO methodology dovetails nicely with the great observation by legendary stock trader Jesse Livermore, who once said that stocks were "never too high to buy and never too low to sell." Figure 2 is a few days later than Figure 1. But the analysis remains relevant. |

|
| FIGURE 2: STOCHASTIC. The stochastic here also shows a positive divergence between August and September. But what is important here is the stochastics' move into overbought territory--a buy signal if prices show followthrough with a higher close. |
| Graphic provided by: Prophet Financial, Inc. |
| |
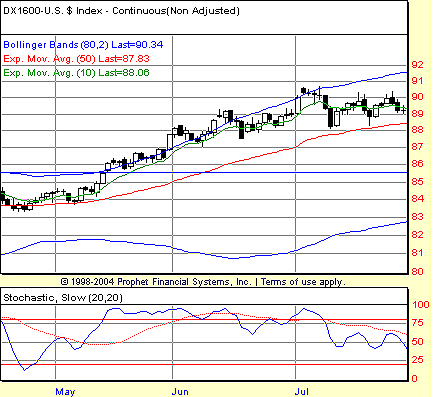
| The snapshot in Figure 2 comes a few days later. Note that prices have continued to move up, as the analysis keying off Figure 1 suggested that it would. Interestingly, having gained three cents in about three weeks (about $3,000), the December greenback has begun a near-parabolic move to the upside, and should shortly be testing the July highs. Any progress above those highs could easily represent the highest prices for dollars since the summer of 2004. The move above the stochastic in late September--a move that would freak out most technicians--can be seen as an opportunity for traders familiar with this BOSO strategy (Figure 3). Note what happened when the December greenback first moved into overbought territory (that is, above 80 in the stochastic) back in May. Since a reading of December futures in May can be a bit misleading, let's look at continuous futures here instead. |

|
| FIGURE 3: BOSO. The BOSO methodology reminds us "it is never too high to buy and never too low to sell." |
| Graphic provided by: Prophet Financial, Inc. |
| |
| After breaking out into overbought territory in mid-May, less than a month later, the greenback was three full points higher. A well-capitalized trader would have likely taken even more than these three points from the market. On an intermediate-term basis, the greenback has been moving lower since early July. On a short-term basis, the greenback has been in rally mode since the beginning of September. Will the bulls be able to reassert the even longer uptrend from the March lows? Will the bears be able to reassert the intermediate-term downtrend? This is the tug-of-war that the bulls and bears are fighting over the greenback right now. |
Technical Writer for Technical Analysis of STOCKS & COMMODITIES magazine, Working-Money.com, and Traders.com Advantage.
| Title: | Technical Writer |
| Company: | Technical Analysis, Inc. |
| Address: | 4757 California Avenue SW |
| Seattle, WA 98116 | |
| Phone # for sales: | 206 938 0570 |
| Fax: | 206 938 1307 |
| Website: | www.Traders.com |
| E-mail address: | DPenn@traders.com |
Traders' Resource Links | |
| Charting the Stock Market: The Wyckoff Method -- Books | |
| Working-Money.com -- Online Trading Services | |
| Traders.com Advantage -- Online Trading Services | |
| Technical Analysis of Stocks & Commodities -- Publications and Newsletters | |
| Working Money, at Working-Money.com -- Publications and Newsletters | |
| Traders.com Advantage -- Publications and Newsletters | |
| Professional Traders Starter Kit -- Software | |
Click here for more information about our publications!
Comments
Date: 09/27/05Rank: 3Comment:
Date: 10/04/05Rank: 4Comment:

Request Information From Our Sponsors
- VectorVest, Inc.
- Executive Premier Workshop
- One-Day Options Course
- OptionsPro
- Retirement Income Workshop
- Sure-Fire Trading Systems (VectorVest, Inc.)
- Trading as a Business Workshop
- VectorVest 7 EOD
- VectorVest 7 RealTime/IntraDay
- VectorVest AutoTester
- VectorVest Educational Services
- VectorVest OnLine
- VectorVest Options Analyzer
- VectorVest ProGraphics v6.0
- VectorVest ProTrader 7
- VectorVest RealTime Derby Tool
- VectorVest Simulator
- VectorVest Variator
- VectorVest Watchdog
- StockCharts.com, Inc.
- Candle Patterns
- Candlestick Charting Explained
- Intermarket Technical Analysis
- John Murphy on Chart Analysis
- John Murphy's Chart Pattern Recognition
- John Murphy's Market Message
- MurphyExplainsMarketAnalysis-Intermarket Analysis
- MurphyExplainsMarketAnalysis-Visual Analysis
- StockCharts.com
- Technical Analysis of the Financial Markets
- The Visual Investor
