HOT TOPICS LIST
- MACD
- Fibonacci
- RSI
- Gann
- ADXR
- Stochastics
- Volume
- Triangles
- Futures
- Cycles
- Volatility
- ZIGZAG
- MESA
- Retracement
- Aroon
INDICATORS LIST
LIST OF TOPICS
PRINT THIS ARTICLE
by Gary Grosschadl
This former gold miner now is breaking out on this weekly chart.
Position: Buy
Gary Grosschadl
Independent Canadian equities trader and technical analyst based in Peterborough
Ontario, Canada.
PRINT THIS ARTICLE
CANDLESTICK CHARTING
Nelson Resources Chases Black Gold
09/27/05 09:10:02 AMby Gary Grosschadl
This former gold miner now is breaking out on this weekly chart.
Position: Buy
| Late in 2002, resource company Nelson Resources (NLG) switched gears, selling its gold interests to focus on the development of its oil reserves in Kazakhstan and the Caspian region. As the oil index more than doubled since 2003, this proved to be a timely move. |
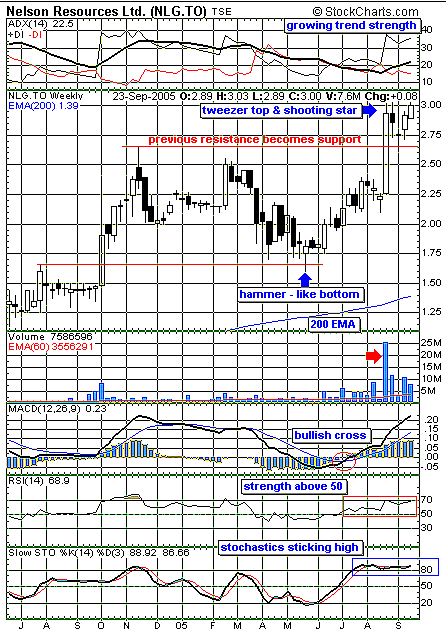
| Several weeks ago, this stock made a breakout move on large volume, jumping from $2.25 to hit $3. After a sudden rise, it is not unusual for a stock to consolidate briefly, and NLG did so. Note the combination tweezer top and shooting star that marked the initial top (Figure 1). Previous resistance became support, roughly lining up with mid-candle support. |

|
| FIGURE 1: NLG.TO. Note the strong trend on this weekly chart of an oil exploration company. |
| Graphic provided by: StockCharts.com. |
| |
| With this week's close above the highest close since the breakout, another bullish phase is likely to be beginning. Several indicators are worth noting. Starting from the top is the average directional movement index (ADX) showing a healthy upslope above the 20 level. This shows growing trend strength, with the directional indicators (DIs) properly positioned via +DI on top. Note how the stock is comfortably above its 200-period exponential moving average (EMA) as its long-term trend is clearly up. |
| The three lower indicators are also confirming bullish strength. The moving average convergence/divergence (MACD) shows a bullish cross that forecast coming strength leading to a move above the zero line. The relative strength indicator (RSI) shows good strength above its 50 level, while the stochastics is showing a tendency to "stick high," another indicator of strong trend strength. |
| The stock is now at historic highs, and technical analysis is limited concerning upside targets. Best advice is to watch for any major topping-out pattern via candlestick analysis, to be confirmed with a deterioration of the indicators previously discussed. |
Independent Canadian equities trader and technical analyst based in Peterborough
Ontario, Canada.
| Website: | www.whatsonsale.ca/financial.html |
| E-mail address: | gwg7@sympatico.ca |
Click here for more information about our publications!
Comments
Date: 09/27/05Rank: 5Comment:
Date: 09/27/05Rank: 5Comment:

Request Information From Our Sponsors
- StockCharts.com, Inc.
- Candle Patterns
- Candlestick Charting Explained
- Intermarket Technical Analysis
- John Murphy on Chart Analysis
- John Murphy's Chart Pattern Recognition
- John Murphy's Market Message
- MurphyExplainsMarketAnalysis-Intermarket Analysis
- MurphyExplainsMarketAnalysis-Visual Analysis
- StockCharts.com
- Technical Analysis of the Financial Markets
- The Visual Investor
- VectorVest, Inc.
- Executive Premier Workshop
- One-Day Options Course
- OptionsPro
- Retirement Income Workshop
- Sure-Fire Trading Systems (VectorVest, Inc.)
- Trading as a Business Workshop
- VectorVest 7 EOD
- VectorVest 7 RealTime/IntraDay
- VectorVest AutoTester
- VectorVest Educational Services
- VectorVest OnLine
- VectorVest Options Analyzer
- VectorVest ProGraphics v6.0
- VectorVest ProTrader 7
- VectorVest RealTime Derby Tool
- VectorVest Simulator
- VectorVest Variator
- VectorVest Watchdog
