HOT TOPICS LIST
- MACD
- Fibonacci
- RSI
- Gann
- ADXR
- Stochastics
- Volume
- Triangles
- Futures
- Cycles
- Volatility
- ZIGZAG
- MESA
- Retracement
- Aroon
INDICATORS LIST
LIST OF TOPICS
PRINT THIS ARTICLE
by Arthur Hill
UPS is testing key support. A downside break would be most bearish for the stock and the Dow transports.
Position: Hold
Arthur Hill
Arthur Hill is currently editor of TDTrader.com, a website specializing in trading strategies, sector/industry specific breadth stats and overall technical analysis. He passed the Society of Technical Analysts (STA London) diploma exam with distinction is a Certified Financial Technician (CFTe). Prior to TD Trader, he was the Chief Technical Analyst for Stockcharts.com and the main contributor to the ChartSchool.
PRINT THIS ARTICLE
HEAD & SHOULDERS
Key Support Test For UPS
09/26/05 09:16:04 AMby Arthur Hill
UPS is testing key support. A downside break would be most bearish for the stock and the Dow transports.
Position: Hold
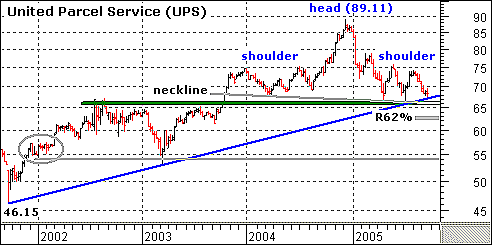
| The big pattern at work is a head & shoulders reversal that extends back to November 2003 (Figure 1). The shoulder formed from November 2003 to August 2004, the head peaked in December 2004, and the right shoulder formed from April 2005 to the present. The neckline slopes down and marks support around 66. A downward sloping neckline is negative because the lower lows reflect more selling pressure. |

|
| FIGURE 1: UPS. This head & shoulders pattern extends back to November 2003. |
| Graphic provided by: MetaStock. |
| Graphic provided by: Reuters Data. |
| |
| Three other items confirm support around 66. First, there is a trendline extending up from September 2002. Second, there is support from broken resistance (July-August 2002 highs). Third, this year's decline marks a 50-62% retracement of the prior advance (46.15 to 89.11). This is the spot for support to be found and a correction to end, but a break above the August high (74.23) is required to negate the head & shoulders pattern and turn bullish. |
| A move below support at 65 would confirm the head & shoulders and project further weakness toward 54-55. The head & shoulders target would be to around 43 (89 - 66 = 23, 66 - 23 = 43). However, I see support from the March 2003 low and January 2002 consolidation (gray oval) around 54-55. The Dow Jones Transportation Average is a price weighted average, and UPS is one of the pricier components. A support break and move to 54 would knock a chunk off of this key average. |
Arthur Hill is currently editor of TDTrader.com, a website specializing in trading strategies, sector/industry specific breadth stats and overall technical analysis. He passed the Society of Technical Analysts (STA London) diploma exam with distinction is a Certified Financial Technician (CFTe). Prior to TD Trader, he was the Chief Technical Analyst for Stockcharts.com and the main contributor to the ChartSchool.
| Title: | Editor |
| Company: | TDTrader.com |
| Address: | Willem Geetsstraat 17 |
| Mechelen, B2800 | |
| Phone # for sales: | 3215345465 |
| Website: | www.tdtrader.com |
| E-mail address: | arthurh@tdtrader.com |
Traders' Resource Links | |
| TDTrader.com has not added any product or service information to TRADERS' RESOURCE. | |
Click here for more information about our publications!
PRINT THIS ARTICLE

Request Information From Our Sponsors
- StockCharts.com, Inc.
- Candle Patterns
- Candlestick Charting Explained
- Intermarket Technical Analysis
- John Murphy on Chart Analysis
- John Murphy's Chart Pattern Recognition
- John Murphy's Market Message
- MurphyExplainsMarketAnalysis-Intermarket Analysis
- MurphyExplainsMarketAnalysis-Visual Analysis
- StockCharts.com
- Technical Analysis of the Financial Markets
- The Visual Investor
- VectorVest, Inc.
- Executive Premier Workshop
- One-Day Options Course
- OptionsPro
- Retirement Income Workshop
- Sure-Fire Trading Systems (VectorVest, Inc.)
- Trading as a Business Workshop
- VectorVest 7 EOD
- VectorVest 7 RealTime/IntraDay
- VectorVest AutoTester
- VectorVest Educational Services
- VectorVest OnLine
- VectorVest Options Analyzer
- VectorVest ProGraphics v6.0
- VectorVest ProTrader 7
- VectorVest RealTime Derby Tool
- VectorVest Simulator
- VectorVest Variator
- VectorVest Watchdog
