HOT TOPICS LIST
- MACD
- Fibonacci
- RSI
- Gann
- ADXR
- Stochastics
- Volume
- Triangles
- Futures
- Cycles
- Volatility
- ZIGZAG
- MESA
- Retracement
- Aroon
INDICATORS LIST
LIST OF TOPICS
PRINT THIS ARTICLE
by David Penn
Midway through its August journey, the NASDAQ broke through a season's worth of support.
Position: N/A
David Penn
Technical Writer for Technical Analysis of STOCKS & COMMODITIES magazine, Working-Money.com, and Traders.com Advantage.
PRINT THIS ARTICLE
TREND-CHANNEL
NASDAQ Abandons Its Trend Channel
09/22/05 07:57:26 AMby David Penn
Midway through its August journey, the NASDAQ broke through a season's worth of support.
Position: N/A
| I am indebted to colleague and Working-Money.com author Sharon Yamanaka for turning me on to the magic of trend channels (see her Working-Money.com series on William O'Neil's CANSLIM method in "Get The CAN In CANSLIM" from August 22 and "CANSLIM II: The Gold At The End Of The Rainbow" from September 7). |
| Combining trend channels with the rules for drawing trendlines as described by Victor Sperandeo in his book Methods Of A Wall Street Master (or see my "Trading With Trendlines," Working-Money.com, August 29) gives traders, speculators, and investors an excellent sense of both how strong a trend is as well as how vulnerable a trend is for reversal. |

|
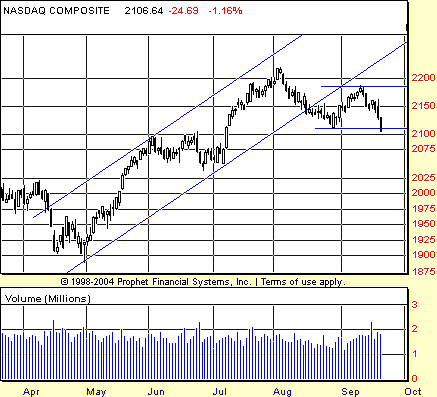
| FIGURE 1: NASDAQ. After breaking down below the lower boundary of its multimonth trend channel in late August, the NASDAQ attempts--and fails--to regain the higher ground in September. |
| Graphic provided by: Prophet Financial, Inc. |
| |
| To draw the channel, I start with a Sperandeo-styled trendline. This means drawing a line from the lowest low (for the time period under consideration) to the highest low that is immediately before the highest high. Do this without passing through any price bars/candlesticks and you've got not only a perfect trendline, but also a sample of how to draw a perfect trendline every time. This is key. If you develop trading rules that have to do with trendlines, then it is important to draw all trendlines in the same way. |
| With the NASDAQ, the trend begins in late April and appears to top in earliest August. By mid-August, the NASDAQ has moved down to and through the trendline of that trend. While this alone was not enough in and of itself to confirm a reversal in trend, the violation of the lower boundary of the trend channel was a warning that the NASDAQ's past "angle of ascent" was too steep. |
| The confirmation of the reversal arrived by mid-September. As shown in Figure 1, what is required for a reversal is first an attempt to reassert the uptrend. This is what the NASDAQ did in the first half of September. If that attempt fails (by, for example, not setting a new high), then the next requirement is for the market to take out the most recent, post-trendline break low. This is precisely what the NASDAQ did in the second half of September. |
Technical Writer for Technical Analysis of STOCKS & COMMODITIES magazine, Working-Money.com, and Traders.com Advantage.
| Title: | Technical Writer |
| Company: | Technical Analysis, Inc. |
| Address: | 4757 California Avenue SW |
| Seattle, WA 98116 | |
| Phone # for sales: | 206 938 0570 |
| Fax: | 206 938 1307 |
| Website: | www.Traders.com |
| E-mail address: | DPenn@traders.com |
Traders' Resource Links | |
| Charting the Stock Market: The Wyckoff Method -- Books | |
| Working-Money.com -- Online Trading Services | |
| Traders.com Advantage -- Online Trading Services | |
| Technical Analysis of Stocks & Commodities -- Publications and Newsletters | |
| Working Money, at Working-Money.com -- Publications and Newsletters | |
| Traders.com Advantage -- Publications and Newsletters | |
| Professional Traders Starter Kit -- Software | |
Click here for more information about our publications!
Comments
Date: 09/22/05Rank: 4Comment:
Date: 09/27/05Rank: 5Comment:
Date: 09/28/05Rank: 2Comment:

Request Information From Our Sponsors
- StockCharts.com, Inc.
- Candle Patterns
- Candlestick Charting Explained
- Intermarket Technical Analysis
- John Murphy on Chart Analysis
- John Murphy's Chart Pattern Recognition
- John Murphy's Market Message
- MurphyExplainsMarketAnalysis-Intermarket Analysis
- MurphyExplainsMarketAnalysis-Visual Analysis
- StockCharts.com
- Technical Analysis of the Financial Markets
- The Visual Investor
- VectorVest, Inc.
- Executive Premier Workshop
- One-Day Options Course
- OptionsPro
- Retirement Income Workshop
- Sure-Fire Trading Systems (VectorVest, Inc.)
- Trading as a Business Workshop
- VectorVest 7 EOD
- VectorVest 7 RealTime/IntraDay
- VectorVest AutoTester
- VectorVest Educational Services
- VectorVest OnLine
- VectorVest Options Analyzer
- VectorVest ProGraphics v6.0
- VectorVest ProTrader 7
- VectorVest RealTime Derby Tool
- VectorVest Simulator
- VectorVest Variator
- VectorVest Watchdog
