HOT TOPICS LIST
- MACD
- Fibonacci
- RSI
- Gann
- ADXR
- Stochastics
- Volume
- Triangles
- Futures
- Cycles
- Volatility
- ZIGZAG
- MESA
- Retracement
- Aroon
INDICATORS LIST
LIST OF TOPICS
PRINT THIS ARTICLE
by Arthur Hill
After a weak rally the last two months, the euro index broke flag support to signal a continuation of the larger downtrend.
Position: Sell
Arthur Hill
Arthur Hill is currently editor of TDTrader.com, a website specializing in trading strategies, sector/industry specific breadth stats and overall technical analysis. He passed the Society of Technical Analysts (STA London) diploma exam with distinction is a Certified Financial Technician (CFTe). Prior to TD Trader, he was the Chief Technical Analyst for Stockcharts.com and the main contributor to the ChartSchool.
PRINT THIS ARTICLE
AROON
Euro Index Breaks Flag Support
09/20/05 08:07:59 AMby Arthur Hill
After a weak rally the last two months, the euro index broke flag support to signal a continuation of the larger downtrend.
Position: Sell
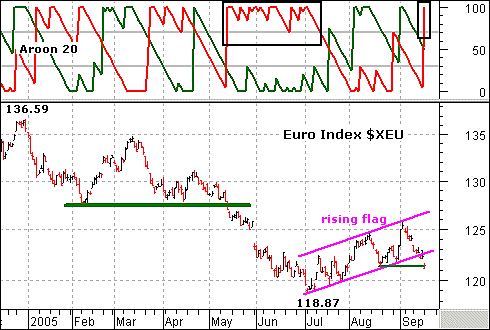
| The decline from ~137 to ~119 established a downtrend with the support break in May (Figure 1). The index became oversold below 120 and a bounce was needed to relieve this oversold condition. Because the bigger trend is down, we should expect a bearish pattern to form on the oversold bounce. The rising flag is classic for corrective rallies within a larger downtrend. It represents a weak rally designed to alleviate the oversold condition and prepare for a continuation lower. |

|
| FIGURE 1: EURO INDEX. Even though the rising flag is a bearish pattern, confirmation is required before turning bearish again. |
| Graphic provided by: MetaStock. |
| Graphic provided by: Reuters Data. |
| |
| Even though the rising flag is a bearish pattern, confirmation is required before turning bearish again. As long as the flag rises, the bulls have the upper hand. For the rising flag on the euro index, a move below the lower trendline and mid-August low would break the advance and signal a continuation lower. The index broke the lower flag trendline and finished right near the August low. The rise has been broken and I would look for lower prices over the next few weeks. |
| The Aroon indicator confirms recent weakness. I am using 20 days or one month. Trending moves usually start with strong moves above 70. A strong downtrend was present from mid-May to mid-July as Aroon down (red) held above 70 for almost two months. It is hard to predict how long a trend will last, but I would consider the trend bearish as long as Aroon down remains above 70 and above Aroon up (green). |
Arthur Hill is currently editor of TDTrader.com, a website specializing in trading strategies, sector/industry specific breadth stats and overall technical analysis. He passed the Society of Technical Analysts (STA London) diploma exam with distinction is a Certified Financial Technician (CFTe). Prior to TD Trader, he was the Chief Technical Analyst for Stockcharts.com and the main contributor to the ChartSchool.
| Title: | Editor |
| Company: | TDTrader.com |
| Address: | Willem Geetsstraat 17 |
| Mechelen, B2800 | |
| Phone # for sales: | 3215345465 |
| Website: | www.tdtrader.com |
| E-mail address: | arthurh@tdtrader.com |
Traders' Resource Links | |
| TDTrader.com has not added any product or service information to TRADERS' RESOURCE. | |
Click here for more information about our publications!
Comments
Date: 09/20/05Rank: 5Comment:
Date: 09/21/05Rank: 4Comment:
Date: 07/19/09Rank: 5Comment:

Request Information From Our Sponsors
- StockCharts.com, Inc.
- Candle Patterns
- Candlestick Charting Explained
- Intermarket Technical Analysis
- John Murphy on Chart Analysis
- John Murphy's Chart Pattern Recognition
- John Murphy's Market Message
- MurphyExplainsMarketAnalysis-Intermarket Analysis
- MurphyExplainsMarketAnalysis-Visual Analysis
- StockCharts.com
- Technical Analysis of the Financial Markets
- The Visual Investor
- VectorVest, Inc.
- Executive Premier Workshop
- One-Day Options Course
- OptionsPro
- Retirement Income Workshop
- Sure-Fire Trading Systems (VectorVest, Inc.)
- Trading as a Business Workshop
- VectorVest 7 EOD
- VectorVest 7 RealTime/IntraDay
- VectorVest AutoTester
- VectorVest Educational Services
- VectorVest OnLine
- VectorVest Options Analyzer
- VectorVest ProGraphics v6.0
- VectorVest ProTrader 7
- VectorVest RealTime Derby Tool
- VectorVest Simulator
- VectorVest Variator
- VectorVest Watchdog
