HOT TOPICS LIST
- MACD
- Fibonacci
- RSI
- Gann
- ADXR
- Stochastics
- Volume
- Triangles
- Futures
- Cycles
- Volatility
- ZIGZAG
- MESA
- Retracement
- Aroon
INDICATORS LIST
LIST OF TOPICS
PRINT THIS ARTICLE
by Dr. RM Sidewitz
Indicators used in trending markets will be different from those used in trendless markets.
Position: N/A
Dr. RM Sidewitz
Dr. Sidewitz is the President, Chief Executive Officer and founder of Qi2 Technologies, LLC, an investment management company and the Managing Member of Qi2 Partners LP, a domestic hedge fund. Dr. Sidewitz began his career on Wall Street in the mid-1960s with Moody's Investors Service. He then served as the Assistant Director of Research for a registered broker/dealer until 1971. In the ensuing years, he continued his pursuits as a private investor during which time he developed the proprietary methodology that is used by the Limited Partnership. Dr. Sidewitz is the author of two books, "How I Double My Money Annually in the Market" and "How to Stop Sabotaging Your Trading Success: Mastering the Inner Realm". He is a frequent contributor to numerous financial publications and continues to work closely with private clients.
PRINT THIS ARTICLE
Aligning Trading Systems And Markets - Part 2
07/28/00 03:24:20 PMby Dr. RM Sidewitz
Indicators used in trending markets will be different from those used in trendless markets.
Position: N/A
| A trendless market is range-bound, making small up-and-down movements with the only discernable direction being sideways. They often appear to be choppy but always remain within a fairly defined range. |
| Studies have shown that markets trend less frequently than fluctuate within a trading range, with the approximate ratio being 20:80. When a market is in a trading range, your objective should be to build profits by taking advantage of the smaller price movements. |

|
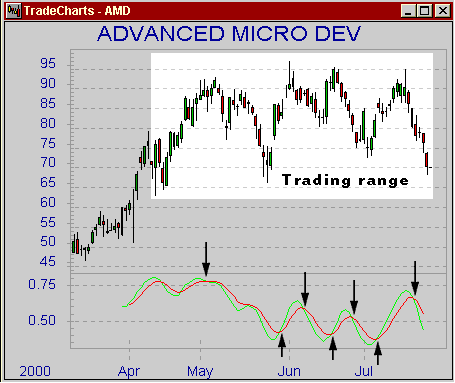
| This chart of AMD's price movement highlights their current trading range. The stochastic indicator is displayed in the bottom section. The arrows indicate buy and sell signals. |
| Graphic provided by: TradeCharts. |
| |
| Support and resistance systems are ideal during a trading range. You can expect to see high percentage returns on your wins although the amount of profit per trade will be smaller than those in trending markets. |
| Indicators that would be effective during trendless markets are overbought/oversold indicators or oscillators such as stochastics and relative strength index (RSI). They generate buy signals when the market reverses from an oversold condition and generate sell signals when the market reverses from an overbought condition. Oscillators are used to identify market tops and bottoms within trading ranges. |
| The chart of Advanced Micro Devices [AMD] displays the effectiveness of using the slow stochastic while the stock is going through a trading range. Notice the correspondence between the buy signals and market bottoms and sell signals and market tops. |
Dr. Sidewitz is the President, Chief Executive Officer and founder of Qi2 Technologies, LLC, an investment management company and the Managing Member of Qi2 Partners LP, a domestic hedge fund. Dr. Sidewitz began his career on Wall Street in the mid-1960s with Moody's Investors Service. He then served as the Assistant Director of Research for a registered broker/dealer until 1971. In the ensuing years, he continued his pursuits as a private investor during which time he developed the proprietary methodology that is used by the Limited Partnership. Dr. Sidewitz is the author of two books, "How I Double My Money Annually in the Market" and "How to Stop Sabotaging Your Trading Success: Mastering the Inner Realm". He is a frequent contributor to numerous financial publications and continues to work closely with private clients.
| Title: | Managing Partner |
| Company: | Qi2 Technologies LLC |
| Address: | 4800 Baseline Road, Suites E104-370 |
| Boulder, CO 80303 | |
| Website: | www.cybrlink.com |
| E-mail address: | doc@cybrlink.com |
Traders' Resource Links | |
| Qi2 Technologies LLC has not added any product or service information to TRADERS' RESOURCE. | |
Click here for more information about our publications!
Comments
Date: / /Rank: 4Comment:
Date: / /Rank: 2Comment:

|

Request Information From Our Sponsors
- StockCharts.com, Inc.
- Candle Patterns
- Candlestick Charting Explained
- Intermarket Technical Analysis
- John Murphy on Chart Analysis
- John Murphy's Chart Pattern Recognition
- John Murphy's Market Message
- MurphyExplainsMarketAnalysis-Intermarket Analysis
- MurphyExplainsMarketAnalysis-Visual Analysis
- StockCharts.com
- Technical Analysis of the Financial Markets
- The Visual Investor
- VectorVest, Inc.
- Executive Premier Workshop
- One-Day Options Course
- OptionsPro
- Retirement Income Workshop
- Sure-Fire Trading Systems (VectorVest, Inc.)
- Trading as a Business Workshop
- VectorVest 7 EOD
- VectorVest 7 RealTime/IntraDay
- VectorVest AutoTester
- VectorVest Educational Services
- VectorVest OnLine
- VectorVest Options Analyzer
- VectorVest ProGraphics v6.0
- VectorVest ProTrader 7
- VectorVest RealTime Derby Tool
- VectorVest Simulator
- VectorVest Variator
- VectorVest Watchdog
