HOT TOPICS LIST
- MACD
- Fibonacci
- RSI
- Gann
- ADXR
- Stochastics
- Volume
- Triangles
- Futures
- Cycles
- Volatility
- ZIGZAG
- MESA
- Retracement
- Aroon
INDICATORS LIST
LIST OF TOPICS
PRINT THIS ARTICLE
by Paolo Pezzutti
Prices are testing their supports after a two-month correction.
Position: N/A
Paolo Pezzutti
Author of the book "Trading the US Markets - A Comprehensive Guide to US Markets for International Traders and Investors" - Harriman House (July 2008)
PRINT THIS ARTICLE
TECHNICAL INDICATORS
Intel: Close To Weekly Supports
09/19/05 08:06:05 AMby Paolo Pezzutti
Prices are testing their supports after a two-month correction.
Position: N/A
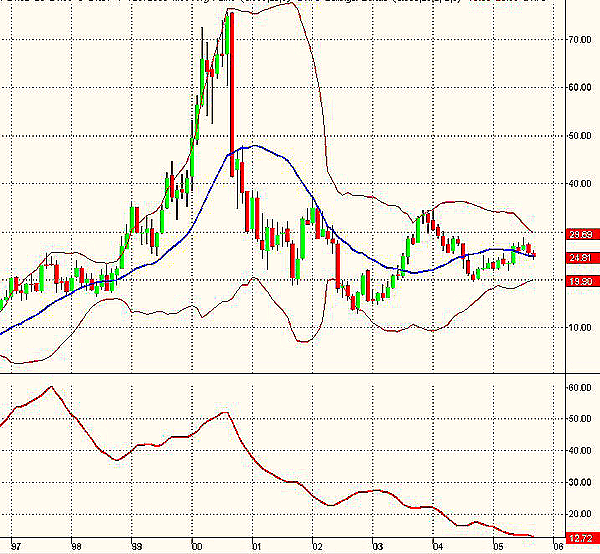
| At the monthly level (Figure 1), Intel's technical situation displays a declining average directional movement index (ADX) that has reached the extremely low level of 12.7, the lowest value since 1989! After the impressive price increase from $10 in 1996 to the high of $75.5, printed in September 2000, the correction brought prices down to about $13 in October 2002. Since then, the price of Intel (INTC) started a recovery movement to the current values around $25. Note that the volatility has been going steadily down in the past years. The Bollinger Bands are still converging, confirming a trading range environment is developing. At this level, I would expect an expansion in volatility with a long-term trend emerging, although it is quite difficult to say when this is going to happen. These phases can be quite long. This situation is common to many stocks. It is difficult to predict the price direction when volatility increases. I believe that long-term investors should approach the market with prudent strategies in this situation. |

|
| FIGURE 1: INTEL MONTHLY CHART. The ADX prints the lowest level since 1989. |
| Graphic provided by: TradeStation. |
| |
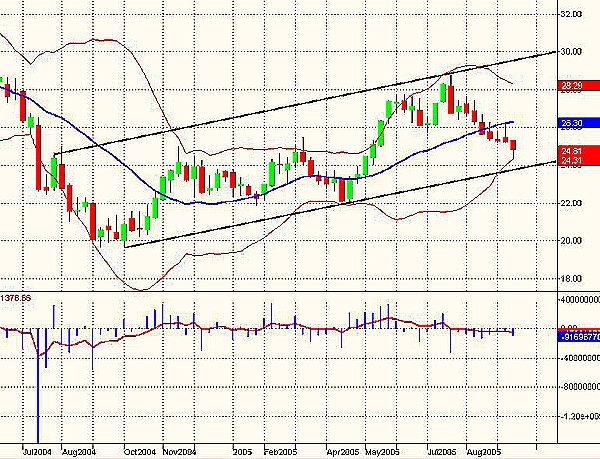
| At the weekly level (Figure 2), prices have been moving in a positively inclined channel since the summer of 2004. From a low of about $20 that was printed in September 2004, INTC reached a top of 28.84 in July 2005. Since then, prices started a correction. In Figure 2, you can see the force index plot. It is an oscillator that attempts to measure the force of the market's participants. The rule is: Force index = Volume * (Close - close of the previous day). It is normally smoothed with a two-day exponential moving average (EMA), giving a buy signal when the two-day EMA of the indicator is negative. The 13-day EMA of the force index is used to identify the longer-term trend. Note that the indicator printed a peak in July 2004, indicating that the downtrend was almost over. Now, it has negative values, confirming the ongoing correction. Prices are close to the support trendline. They have been going down for seven consecutive weeks. Bollinger Bands are closing with prices tagging the lower band, indicating, for the moment, the absence of a directional action. |

|
| FIGURE 2: INTEL WEEKLY CHART. Prices are close to the support trendline of a positively inclined channel. |
| Graphic provided by: TradeStation. |
| |
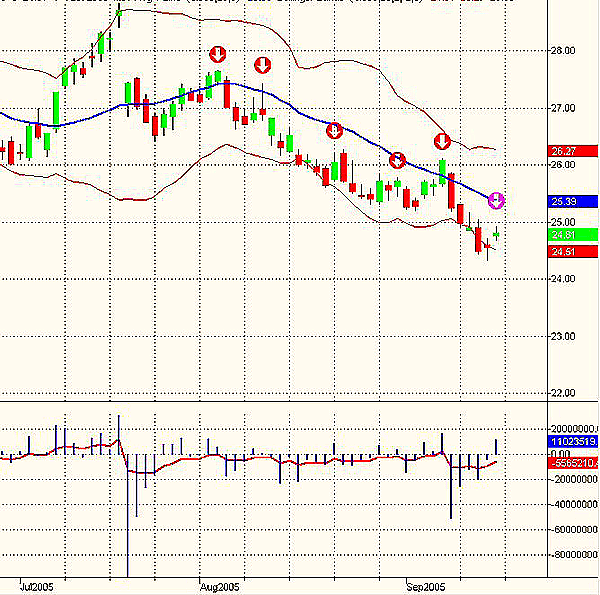
| In the daily chart (Figure 3), a runaway gap on July 20 started the current down movement. So far, prices during this movement have lost about 10%. As you can see in Figure 3, the force index gave accurate sell signals during the downtrend when, after a sell setup, prices went below the low of that day. During the last trading session on September 16, the indicator printed another sell setup for the next day (pink arrow). Note that during the past four sessions, the indicator printed a divergence that could anticipate, at least, a rebound from these levels. |

|
| FIGURE 3: INTEL DAILY CHART. The force index indicates a sell setup for the next trading session. |
| Graphic provided by: TradeStation. |
| |
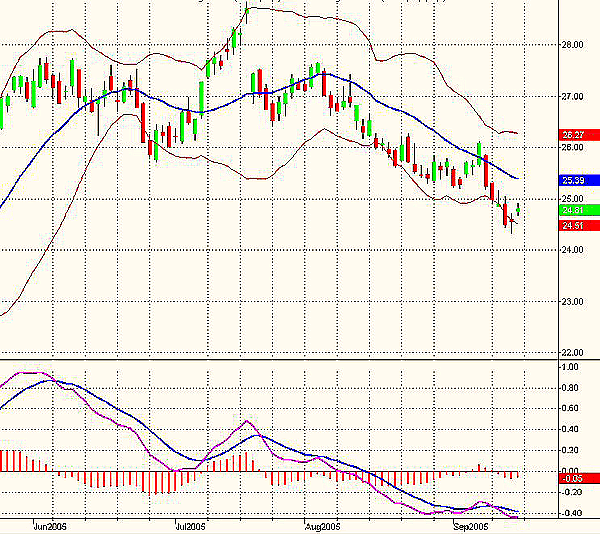
| In Figure 4, I used the moving average convergence/divergence (MACD) indicator to assess the technical situation. It calculates two exponential moving averages. The difference between these two averages is plotted as the MACD (pink line). This value is averaged and then plotted as the MACDAvg (blue line). The difference between MACD and MACD average is plotted as the MACDDiff (red histogram). Note that the indicator printed a very significant divergence at the top of July 2005. Now the MACD is negative confirming, so far, the ongoing movement. Only the MACDiff displays a slight divergence. In this condition, traders should approach the market with different tactics depending on the time frame. Longer time frames should, however, guide your vision of the market. |

|
| FIGURE 4: INTEL DAILY CHART WITH THE MACD |
| Graphic provided by: TradeStation. |
| |
Author of the book "Trading the US Markets - A Comprehensive Guide to US Markets for International Traders and Investors" - Harriman House (July 2008)
| Address: | VIA ROBERTO AGO 26 POSTAL CODE 00166 |
| Rome, ITALY | |
| Phone # for sales: | +393357540708 |
| E-mail address: | pezzutti.paolo@tiscali.it |
Click here for more information about our publications!
Comments
Date: 09/19/05Rank: 3Comment:

Request Information From Our Sponsors
- StockCharts.com, Inc.
- Candle Patterns
- Candlestick Charting Explained
- Intermarket Technical Analysis
- John Murphy on Chart Analysis
- John Murphy's Chart Pattern Recognition
- John Murphy's Market Message
- MurphyExplainsMarketAnalysis-Intermarket Analysis
- MurphyExplainsMarketAnalysis-Visual Analysis
- StockCharts.com
- Technical Analysis of the Financial Markets
- The Visual Investor
- VectorVest, Inc.
- Executive Premier Workshop
- One-Day Options Course
- OptionsPro
- Retirement Income Workshop
- Sure-Fire Trading Systems (VectorVest, Inc.)
- Trading as a Business Workshop
- VectorVest 7 EOD
- VectorVest 7 RealTime/IntraDay
- VectorVest AutoTester
- VectorVest Educational Services
- VectorVest OnLine
- VectorVest Options Analyzer
- VectorVest ProGraphics v6.0
- VectorVest ProTrader 7
- VectorVest RealTime Derby Tool
- VectorVest Simulator
- VectorVest Variator
- VectorVest Watchdog
