

HOT TOPICS LIST
- MACD
- Fibonacci
- RSI
- Gann
- ADXR
- Stochastics
- Volume
- Triangles
- Futures
- Cycles
- Volatility
- ZIGZAG
- MESA
- Retracement
- Aroon
INDICATORS LIST
LIST OF TOPICS
PRINT THIS ARTICLE
by Koos van der Merwe
Anyone who calls him- or herself a chartist knows about Joseph Granville and on-balance volume. Here is a variation on his original formula, applied to Bema Gold.
Position: Buy
Koos van der Merwe
Has been a technical analyst since 1969, and has worked as a futures and options trader with First Financial Futures in Johannesburg, South Africa.
PRINT THIS ARTICLE
ON BALANCE VOLUME
On-Balance Volume Variation
09/15/05 01:55:04 PMby Koos van der Merwe
Anyone who calls him- or herself a chartist knows about Joseph Granville and on-balance volume. Here is a variation on his original formula, applied to Bema Gold.
Position: Buy
| Joe Granville, the father of the on-balance volume (OBV) technique of trading the stock market, may have been the first to successfully use volume as a method to determine buys or sells on a share. We all know that OBV is a running total of volume where, should the security close higher than the previous day, volume is added to a cumulative total, and should the security close lower that the previous day, volume is subtracted from the cumulative total. A buy signal is given when the cumulative total rises above a previous pivot peak, and a sell signal is given when it closes below a previous pivot trough. When OBV is trading sideways and not making successive highs and lows, it is in a doubtful trend. However, once a trend is established, it remains in force until it is broken. There are two ways in which the OBV trend can be broken. The first occurs when the trend changes from a rising trend to a falling trend, or from a falling trend to a rising trend. |
| The second way the OBV trend can be broken is if the trend changes to a doubtful trend and remains doubtful for more than four days. Thus, if the security changes from a rising trend to a doubtful one and remains doubtful for only three days before changing back to a rising trend, the OBV is considered to have always been in a rising trend. This rule can be ignored, with the share price remaining in a trend until a stop-loss or an opposite OBV signal is triggered. Once Granville showed how successful OBV was, many tried to improve on the formula. Below is one of the suggested improvements with a MetaStock formula showing how I have applied it and used it. The variation I use divides daily volume into up volume and down volume. Up volume is the close minus the low divided by that day's range. The result is multiplied by the day's volume. Down volume is the high of the day minus the close of the day divided by the day's range and multiplied by the volume. The MetaStock formula below includes the pivot point formula for determining a buy or sell signal. The formula has been inserted into Expert Advisor so that an indicator can be shown on the chart. |
| The OBV variation formula for Expert Advisor MetaStock: UV:= ((CLOSE - LOW)/ (HIGH - LOW))*VOLUME; DV:= ((HIGH - CLOSE)/ (HIGH - LOW))*VOLUME; JOBV:=Cum( If( C, >, Ref(C,-1), + UV, If( C, <, Ref(C,-1), - DV, 0) )); Hg:= HHV( JOBV,20 ) ; By:= JOBV > Hg ; Lg:= LLV(JOBV , 20) ; sl:= JOBV < Lg; By |
|
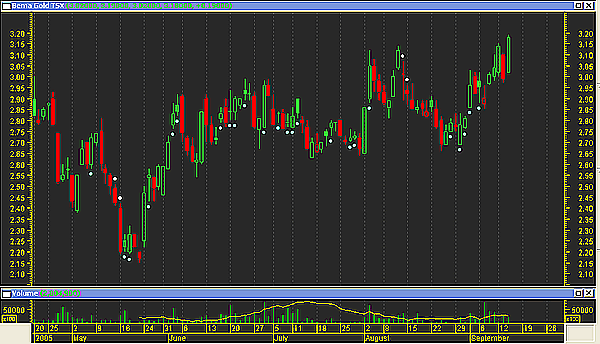
| FIGURE 1: BEMA GOLD WITH OBV SIGNALS. The light blue dots below a price show a buy signal and will continue to do so until a sell signal is given. A short sell signal is indicated by the white dots above the price and will continue to do so until a buy signal is given or a stop-loss is triggered. |
| Graphic provided by: MetaStock. |
| |
| The light blue dots on Figure 1 below a price show a buy signal and will continue to show a buy signal until a sell is given or a stop-loss signal is triggered. A short sell signal is shown by the white dots above the price and will remain in force until a buy signal is given or a stop-loss is triggered. This technique looks interesting and can be added to your quiver of indicators. |
Has been a technical analyst since 1969, and has worked as a futures and options trader with First Financial Futures in Johannesburg, South Africa.
| Address: | 3256 West 24th Ave |
| Vancouver, BC | |
| Phone # for sales: | 6042634214 |
| E-mail address: | petroosp@gmail.com |
Click here for more information about our publications!
Comments
Date:�09/15/05Rank:�5Comment:�
Date:�09/18/05Rank:�3Comment:�
Date:�12/06/05Rank:�4Comment:�we ll see how accurate it is in real time.

Request Information From Our Sponsors
- StockCharts.com, Inc.
- Candle Patterns
- Candlestick Charting Explained
- Intermarket Technical Analysis
- John Murphy on Chart Analysis
- John Murphy's Chart Pattern Recognition
- John Murphy's Market Message
- MurphyExplainsMarketAnalysis-Intermarket Analysis
- MurphyExplainsMarketAnalysis-Visual Analysis
- StockCharts.com
- Technical Analysis of the Financial Markets
- The Visual Investor
- VectorVest, Inc.
- Executive Premier Workshop
- One-Day Options Course
- OptionsPro
- Retirement Income Workshop
- Sure-Fire Trading Systems (VectorVest, Inc.)
- Trading as a Business Workshop
- VectorVest 7 EOD
- VectorVest 7 RealTime/IntraDay
- VectorVest AutoTester
- VectorVest Educational Services
- VectorVest OnLine
- VectorVest Options Analyzer
- VectorVest ProGraphics v6.0
- VectorVest ProTrader 7
- VectorVest RealTime Derby Tool
- VectorVest Simulator
- VectorVest Variator
- VectorVest Watchdog