

HOT TOPICS LIST
- MACD
- Fibonacci
- RSI
- Gann
- ADXR
- Stochastics
- Volume
- Triangles
- Futures
- Cycles
- Volatility
- ZIGZAG
- MESA
- Retracement
- Aroon
INDICATORS LIST
LIST OF TOPICS
PRINT THIS ARTICLE
by David Penn
The v-shaped post-Katrina rally ends not with a bang, but with a trendline break.
Position: N/A
David Penn
Technical Writer for Technical Analysis of STOCKS & COMMODITIES magazine, Working-Money.com, and Traders.com Advantage.
PRINT THIS ARTICLE
REVERSAL
A 1-2-3 Trend Reversal In The S&P 500
09/15/05 12:34:44 PMby David Penn
The v-shaped post-Katrina rally ends not with a bang, but with a trendline break.
Position: N/A
| In my last few Traders.com Advantage articles, I have written about the technical origins for the post-Katrina rally in the Standard & Poor's 500 (most recently, "Bullish Engulfing Piercing Pattern Bottom Baby," September 13, 2005; but also "Portrait Of A Short Squeeze," September 9; and "Elliott Wave Update," September 9). |
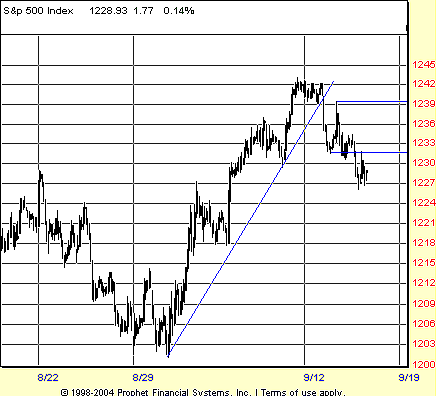
| And so far, it appears as if this article will address the technical origins for the demise of the post-Katrina rally. Those origins are diverse and numerous, as is the case with all market turns. But here I want to focus on the simplest: the 1-2-3 trend reversal. See Figure 1. |
|
| FIGURE 1: 1-2-3. A classic 1-2-3 trend reversal suggests more downside to come in the S&P 500. Most obvious support is at 1218. |
| Graphic provided by: Prophet Financial, Inc. |
| |
| Those who have read my Working-Money.com article "Trading With Trendlines" (August 29, 2005) will already be familiar with this simple, yet powerful way to determine a change in trend. For those who aren't familiar with the 1-2-3 trend reversal popularized by Victor Sperandeo in his book, Trader Vic: Methods Of A Wall Street Master, this should serve as a primer that will make it easy to spot these opportunities as they arise in real-time. The "1" of the 1-2-3 trend reversal represents the initial trendline break. It is important that the trendline be drawn accurately. For an uptrend, this means that the trendline is drawn so that it connects the lowest low that will serve as the initial reference point with the highest low immediately preceding the highest high. This should be done so that the trendline does not pass through any price points in between. |
| Just such a trendline is shown in Figure 1, an hourly chart of the $SPX. Note that the initial trendline break occurs around 1240, with prices falling to about the 1232-33 level. Note in addition that this is in the neighborhood of potential support at 1230. This potential support comes from the last significant correction low in the previous rally. The "2" of the 1-2-3 trend reversal represents the attempt by prices, after the trendline break, to reassert the previous--still prevailing--trend. In the case of an uptrend line that is broken, the "2" will be an attempt to test or even set a new high. Here, the market shoots up past the 1239 level, but fails to take any higher ground and begins slipping back. |
| The "3" of the 1-2-3 trend reversal represents the move back down after the failure in step 2. Generally, the "3" is thought to be completed when prices move back down below the low from step 1. If step 3 is reached, then it can be said that a trend reversal has in fact occurred. In the case of the rally in Figure 1, the move back below about 1231.50 marked a completed step 3. This move occurred late in the day on September 13, and while prices have temporarily ticked back above the 1231.50 level, there is now sound evidence that the path of least resistance for the S&P 500 is downward for the near term. |
Technical Writer for Technical Analysis of STOCKS & COMMODITIES magazine, Working-Money.com, and Traders.com Advantage.
| Title: | Technical Writer |
| Company: | Technical Analysis, Inc. |
| Address: | 4757 California Avenue SW |
| Seattle, WA 98116 | |
| Phone # for sales: | 206 938 0570 |
| Fax: | 206 938 1307 |
| Website: | www.Traders.com |
| E-mail address: | DPenn@traders.com |
Traders' Resource Links | |
| Charting the Stock Market: The Wyckoff Method -- Books | |
| Working-Money.com -- Online Trading Services | |
| Traders.com Advantage -- Online Trading Services | |
| Technical Analysis of Stocks & Commodities -- Publications and Newsletters | |
| Working Money, at Working-Money.com -- Publications and Newsletters | |
| Traders.com Advantage -- Publications and Newsletters | |
| Professional Traders Starter Kit -- Software | |
Click here for more information about our publications!
Comments
Date:�09/18/05Rank:�4Comment:�

Request Information From Our Sponsors
- VectorVest, Inc.
- Executive Premier Workshop
- One-Day Options Course
- OptionsPro
- Retirement Income Workshop
- Sure-Fire Trading Systems (VectorVest, Inc.)
- Trading as a Business Workshop
- VectorVest 7 EOD
- VectorVest 7 RealTime/IntraDay
- VectorVest AutoTester
- VectorVest Educational Services
- VectorVest OnLine
- VectorVest Options Analyzer
- VectorVest ProGraphics v6.0
- VectorVest ProTrader 7
- VectorVest RealTime Derby Tool
- VectorVest Simulator
- VectorVest Variator
- VectorVest Watchdog
- StockCharts.com, Inc.
- Candle Patterns
- Candlestick Charting Explained
- Intermarket Technical Analysis
- John Murphy on Chart Analysis
- John Murphy's Chart Pattern Recognition
- John Murphy's Market Message
- MurphyExplainsMarketAnalysis-Intermarket Analysis
- MurphyExplainsMarketAnalysis-Visual Analysis
- StockCharts.com
- Technical Analysis of the Financial Markets
- The Visual Investor