

HOT TOPICS LIST
- MACD
- Fibonacci
- RSI
- Gann
- ADXR
- Stochastics
- Volume
- Triangles
- Futures
- Cycles
- Volatility
- ZIGZAG
- MESA
- Retracement
- Aroon
INDICATORS LIST
LIST OF TOPICS
PRINT THIS ARTICLE
by Arthur Hill
After a sharp rally, the Standard & Poor's 500 EFT formed a harami at resistance and on-balance volume sported a large negative divergence.
Position: Hold
Arthur Hill
Arthur Hill is currently editor of TDTrader.com, a website specializing in trading strategies, sector/industry specific breadth stats and overall technical analysis. He passed the Society of Technical Analysts (STA London) diploma exam with distinction is a Certified Financial Technician (CFTe). Prior to TD Trader, he was the Chief Technical Analyst for Stockcharts.com and the main contributor to the ChartSchool.
PRINT THIS ARTICLE
CANDLESTICK CHARTING
SPY Forms Harami At Resistance
09/13/05 01:04:48 PMby Arthur Hill
After a sharp rally, the Standard & Poor's 500 EFT formed a harami at resistance and on-balance volume sported a large negative divergence.
Position: Hold
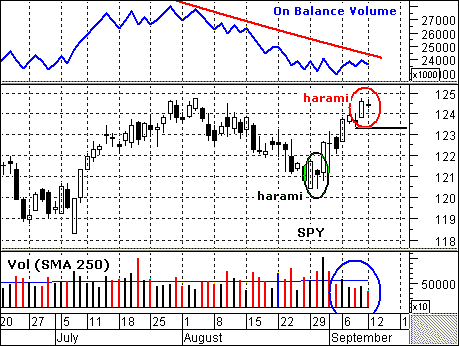
| A harami kicked off the recent rally, and a harami could end it as well. In a harami, the first candlestick is long, while the second candlestick is smaller and the opposite color. In addition, the second candlestick is nestled inside the first and forms as an inside day. The bullishness or bearishness of the pattern depends on the direction of the trend. In a downtrend, a harami is a potentially bullish reversal. In an uptrend, a harami is a potentially bearish reversal. |
|
| FIGURE 1: SPY. SPY formed a bullish harami on August 29-30 (green oval) and confirmed this pattern with a surge on August 31. |
| Graphic provided by: MetaStock. |
| Graphic provided by: Reuters Data. |
| |
| The Standard & Poor's 500 exchange traded fund (SPY) formed a bullish harami on August 29-30 (green oval) and confirmed this pattern with a surge on August 31 (Figure 1). There was a long white candlestick on August 29 and a smaller black candlestick on August 30 inside. Similarly, the index formed another harami on September 9 and 12. The first candlestick is a long white candlestick and the second is a small black candlestick within. This has yet to be confirmed, and a move below 123.3 would do the trick. In addition, note that the harami formed near resistance. |
| In addition to the harami, volume and a key volume indicator have not been impressive during this rally. The breakout above 122 saw good volume, but it soon dried up as the stock moved above 123 and 124 (blue arrow). In addition, the on-balance volume indicator peaked in early August and formed a sharp negative divergence. SPY is testing resistance and OBV is well below its corresponding August high. This is a blatant nonconfirmation by volume, and traders should watch SPY closely as it trades near resistance with a bearish candlestick pattern. |
Arthur Hill is currently editor of TDTrader.com, a website specializing in trading strategies, sector/industry specific breadth stats and overall technical analysis. He passed the Society of Technical Analysts (STA London) diploma exam with distinction is a Certified Financial Technician (CFTe). Prior to TD Trader, he was the Chief Technical Analyst for Stockcharts.com and the main contributor to the ChartSchool.
| Title: | Editor |
| Company: | TDTrader.com |
| Address: | Willem Geetsstraat 17 |
| Mechelen, B2800 | |
| Phone # for sales: | 3215345465 |
| Website: | www.tdtrader.com |
| E-mail address: | arthurh@tdtrader.com |
Traders' Resource Links | |
| TDTrader.com has not added any product or service information to TRADERS' RESOURCE. | |
Click here for more information about our publications!
Comments
Date:�09/13/05Rank:�4Comment:�

Request Information From Our Sponsors
- StockCharts.com, Inc.
- Candle Patterns
- Candlestick Charting Explained
- Intermarket Technical Analysis
- John Murphy on Chart Analysis
- John Murphy's Chart Pattern Recognition
- John Murphy's Market Message
- MurphyExplainsMarketAnalysis-Intermarket Analysis
- MurphyExplainsMarketAnalysis-Visual Analysis
- StockCharts.com
- Technical Analysis of the Financial Markets
- The Visual Investor
- VectorVest, Inc.
- Executive Premier Workshop
- One-Day Options Course
- OptionsPro
- Retirement Income Workshop
- Sure-Fire Trading Systems (VectorVest, Inc.)
- Trading as a Business Workshop
- VectorVest 7 EOD
- VectorVest 7 RealTime/IntraDay
- VectorVest AutoTester
- VectorVest Educational Services
- VectorVest OnLine
- VectorVest Options Analyzer
- VectorVest ProGraphics v6.0
- VectorVest ProTrader 7
- VectorVest RealTime Derby Tool
- VectorVest Simulator
- VectorVest Variator
- VectorVest Watchdog