HOT TOPICS LIST
- MACD
- Fibonacci
- RSI
- Gann
- ADXR
- Stochastics
- Volume
- Triangles
- Futures
- Cycles
- Volatility
- ZIGZAG
- MESA
- Retracement
- Aroon
INDICATORS LIST
LIST OF TOPICS
PRINT THIS ARTICLE
by David Penn
With apologies to Tom Wolfe, the late August reversal in the SPDRs provided plenty of clues for those short to become long.
Position: N/A
David Penn
Technical Writer for Technical Analysis of STOCKS & COMMODITIES magazine, Working-Money.com, and Traders.com Advantage.
PRINT THIS ARTICLE
CANDLESTICK CHARTING
Bullish Engulfing Piercing Pattern Bottom Baby
09/13/05 08:49:05 AMby David Penn
With apologies to Tom Wolfe, the late August reversal in the SPDRs provided plenty of clues for those short to become long.
Position: N/A
| For someone who had been short throughout August, the price action on the 29th day of that month was cause for both alarm and celebration: alarm, because that day suggested that the bearish times might be coming to at least a short-term conclusion, and celebration because it seemed as the market was more than willing to telegraph its intentions to head higher in the near term. |
| Some would probably argue that the latter cause for celebration is unnecessary insofar as the market always telegraphs its next move in one fashion or another. Per this line of thinking--which is chapter if not verse for those who love and fear technical analysis--there will always be intentions to divine and precious little price action coming out of nowhere. |

|
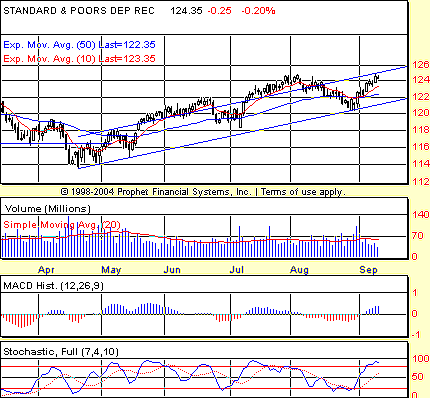
| FIGURE 1: SPDR. The bull market that began in April suffered its most serious correction in August, as the S&P 500 retreated to the lower boundary of an old trend channel. |
| Graphic provided by: Prophet Financial, Inc. |
| |
| In any event, there were a number of tells anticipating an end to the August decline. The short-term positive divergence over the second half of August was one clue of waning selling pressure (Figure 1). The fact that the market had retreated to the lower boundary of a trend channel that extended back to mid-April, a lower boundary that could provide support to a declining market, was also a factor worthy of consideration. But looking closely at the price action in late August, another signal--or set of technical signals--becomes apparent. For just as that second-half-of-August positive stochastic divergence was forming and the potential for support in the old trend channel growing greater, price and volume themselves began to suggest that a move higher in the near term was as likely or more so than a continuation of the month-long drift lower. |

|
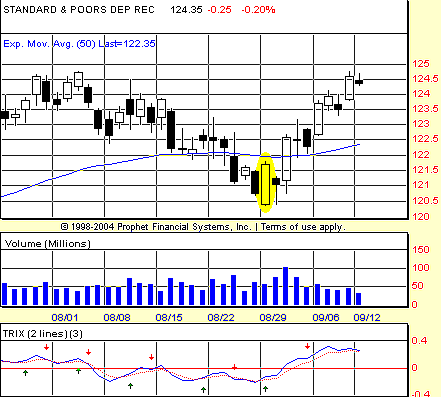
| FIGURE 2. The bullish engulfing day on August 29 is accompanied by a TRIX buy signal. An entry two days later would have been nicely profitable within six days after that. |
| Graphic provided by: Prophet Financial, Inc. |
| |
| Note how the market on August 29 opens at a new low for the decline, yet closes above the previous day's high. In the context of the downtrend that had characterized August, this turned August 29 into a bullish engulfing day. This development was a strong indication that the market had moved as low as it was going to move for the time being. Interestingly, the TRIX indicator provided a buy signal as of the close of August 29 as well. A speculator seeing this--especially in concert with some of the other reversal-oriented factors already mentioned above--would have been encouraged to take profits on short positions and consider initiating new longs in the direction of the old April-August uptrend. It is also worth pointing out that even if the day had not been a bullish engulfing day (by closing above the previous day's high), then it still would have likely anticipated a bullish reversal by acting as a piercing pattern. Bullish piercing patterns look a great deal like the market in Figure 2, with the difference being that the highs of piercing patterns often do not take out previous highs. In fact, when I first looked at this chart, it was the "piercing" part of the pattern that first caught my eye and told me this was a market that was heading higher. |
| There are a number of entry strategies. A trader could add half the range of the bullish engulfing day to the high of that day for an entry target near 122.48. Another strategy would be to buy the next close above the high of the bullish engulfing day, or the next close above 121.78. Either approach would have provided for a long entry two days later on August 31. Options traders, for example, could have bought the September 122 SPY calls for 1.40 end of day August 31. And what a purchase it was! Owners of September 122 SPY calls would have been handsomely rewarded with a near double merely six days after establishing the position (September 122 SPY calls closed at 2.70 on September 9, with an intraday print of 2.85). |
Technical Writer for Technical Analysis of STOCKS & COMMODITIES magazine, Working-Money.com, and Traders.com Advantage.
| Title: | Technical Writer |
| Company: | Technical Analysis, Inc. |
| Address: | 4757 California Avenue SW |
| Seattle, WA 98116 | |
| Phone # for sales: | 206 938 0570 |
| Fax: | 206 938 1307 |
| Website: | www.Traders.com |
| E-mail address: | DPenn@traders.com |
Traders' Resource Links | |
| Charting the Stock Market: The Wyckoff Method -- Books | |
| Working-Money.com -- Online Trading Services | |
| Traders.com Advantage -- Online Trading Services | |
| Technical Analysis of Stocks & Commodities -- Publications and Newsletters | |
| Working Money, at Working-Money.com -- Publications and Newsletters | |
| Traders.com Advantage -- Publications and Newsletters | |
| Professional Traders Starter Kit -- Software | |
Click here for more information about our publications!
Comments
Date: 09/13/05Rank: 3Comment:

Request Information From Our Sponsors
- StockCharts.com, Inc.
- Candle Patterns
- Candlestick Charting Explained
- Intermarket Technical Analysis
- John Murphy on Chart Analysis
- John Murphy's Chart Pattern Recognition
- John Murphy's Market Message
- MurphyExplainsMarketAnalysis-Intermarket Analysis
- MurphyExplainsMarketAnalysis-Visual Analysis
- StockCharts.com
- Technical Analysis of the Financial Markets
- The Visual Investor
- VectorVest, Inc.
- Executive Premier Workshop
- One-Day Options Course
- OptionsPro
- Retirement Income Workshop
- Sure-Fire Trading Systems (VectorVest, Inc.)
- Trading as a Business Workshop
- VectorVest 7 EOD
- VectorVest 7 RealTime/IntraDay
- VectorVest AutoTester
- VectorVest Educational Services
- VectorVest OnLine
- VectorVest Options Analyzer
- VectorVest ProGraphics v6.0
- VectorVest ProTrader 7
- VectorVest RealTime Derby Tool
- VectorVest Simulator
- VectorVest Variator
- VectorVest Watchdog
