HOT TOPICS LIST
- MACD
- Fibonacci
- RSI
- Gann
- ADXR
- Stochastics
- Volume
- Triangles
- Futures
- Cycles
- Volatility
- ZIGZAG
- MESA
- Retracement
- Aroon
INDICATORS LIST
LIST OF TOPICS
PRINT THIS ARTICLE
by Koos van der Merwe
In the United States, a collapse in the price of a company to this extent would have resulted in prosecution. In Canada, however...
Position: Buy
Koos van der Merwe
Has been a technical analyst since 1969, and has worked as a futures and options trader with First Financial Futures in Johannesburg, South Africa.
PRINT THIS ARTICLE
ELLIOTT WAVE
Would You Buy Nortel Networks?
09/13/05 08:29:48 AMby Koos van der Merwe
In the United States, a collapse in the price of a company to this extent would have resulted in prosecution. In Canada, however...
Position: Buy
| Nortel Networks supplies its customers with communications technology and infrastructure to enable IP data, voice and multimedia services spanning wireless networks, wireline networks, enterprise networks and optical networks. It's a great company with a good product. At the height of the stock market bubble, the share price reached a high of $89 on July 31, 2000. It then proceeded to collapse to $0.43 by October 31, 2002, destroying the savings of thousands of investors as accounting procedures came under investigation. Serious accounting issues forced the company to restate financial results from 2001 to 2003. Had this company been a US company based in New York state, NY state attorney general Eliot Spitzer would have found a reason to prosecute management. He would have looked for any excuse to prosecute, as shown with Martha Stewart, who was convicted not on insider trading but on not telling the truth when confronted. However, Nortel is a Canadian corporation, and although management has changed and accounting procedures and reporting have been cleaned, no blame has been laid as to who was responsible for the mess. There have been no prosecutions, and a shareholders' complaint filed last year in the US against Nortel Networks and certain present and former directors and executives was dismissed in US District Court on August 30, 2005. Knowing all this, would you today invest in Nortel? |

|
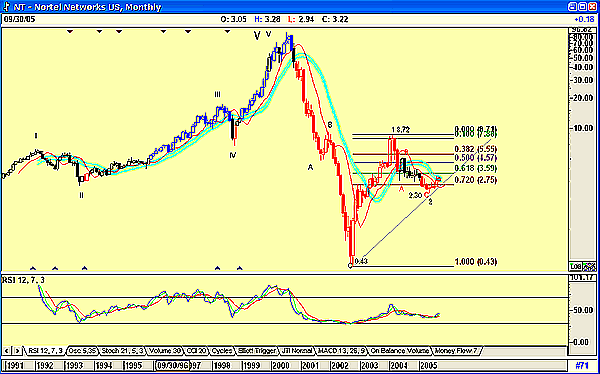
| FIGURE 1: NORTEL MONTHLY |
| Graphic provided by: AdvancedGET. |
| |
| Figure 1 is a semilogarithmic monthly chart of Nortel and shows the dramatic collapse of the stock. The wave count may look correct but it is not, because I am sure that the collapse to $0.43 was lower than the original IPO price. We are always taught that we should NOT become emotionally involved in a company. You should therefore look at Nortel not as a company that lost investors millions of dollars, but as a company where we can make a profit trading the stock. The monthly chart shows how the share price rose from $0.43 to $8.72 in what appears to be a wave 1. It then dropped to $2.30 in what could be a wave 2. I write could be, because wave 2 could develop into an a-b-c retracement. The retracement did seem to consolidate around the 72% level, a percentage I have found to be more than correct for a wave 2 retracement. The moving average convergence/divergence (MACD) oscillator is also suggesting that the price movement could be up. |

|
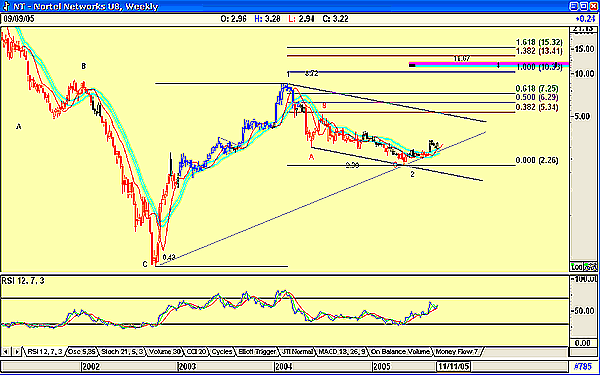
| FIGURE 2: NORTEL WEEKLY |
| Graphic provided by: AdvancedGET. |
| |
| Figure 2 is a weekly chart, and this shows that wave 2 could indeed be complete, as it retraced an a-b-c correction, and appears to be forming the starting of a wave 3 upward. This is suggested by the relative strength index oscillator, which is moving up. Possible resistance points as determined by Fibonacci projections are $5.39, $6.29, or $7.25, with the MOB (make or break) indicator suggesting a target of $11.67. The MOB study is an excellent tool that can help you find the target price area for any pattern that has an impulse-correction-impulse wave. It is a proprietary indicator of Advanced GET. |

|
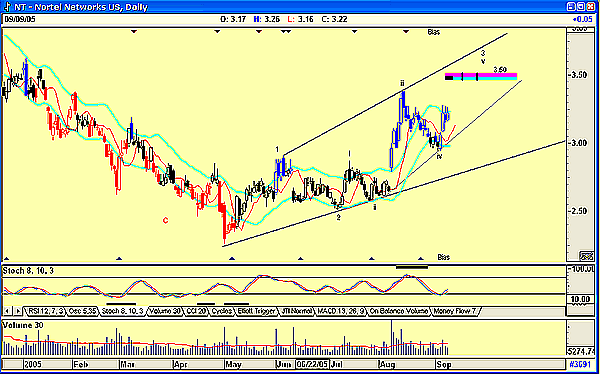
| FIGURE 3: NORTEL DAILY |
| Graphic provided by: AdvancedGET. |
| |
| Figure 3 suggests a top to a wave 3 as $3.50. The weekly projections therefore do seem a bit overoptimistic, but we never know. The stochastic oscillator is suggesting strength. In addition, the bias indicator is suggesting a buy. The bias reversal indicates a potential change in trend (a reversal of a bias) point. When the bias reversal is indicated at the top of the screen, it indicates some degree of a change in trend and the market should move down. The opposite is true when the bias reversal is indicated at the bottom of the chart. One problem with the chart appears to be extreme volatility. Price movement is not the clear steady movement we would like to see. This is shown in the volume, which is continually breaking above and below its 30-period average. Is Nortel a buy at the present price? The trumpet (widening) formation of the trendlines are telling us to be careful. A widening formation suggests uncertainty, and the maxim "When in doubt, stay out" will apply. My recommendation is therefore to use Nortel for trading, but the risk is there. Keep your stop tight and above all, BE CAREFUL. |
Has been a technical analyst since 1969, and has worked as a futures and options trader with First Financial Futures in Johannesburg, South Africa.
| Address: | 3256 West 24th Ave |
| Vancouver, BC | |
| Phone # for sales: | 6042634214 |
| E-mail address: | petroosp@gmail.com |
Click here for more information about our publications!
Comments
Date: 09/13/05Rank: 2Comment:
Date: 09/13/05Rank: 5Comment:

Request Information From Our Sponsors
- StockCharts.com, Inc.
- Candle Patterns
- Candlestick Charting Explained
- Intermarket Technical Analysis
- John Murphy on Chart Analysis
- John Murphy's Chart Pattern Recognition
- John Murphy's Market Message
- MurphyExplainsMarketAnalysis-Intermarket Analysis
- MurphyExplainsMarketAnalysis-Visual Analysis
- StockCharts.com
- Technical Analysis of the Financial Markets
- The Visual Investor
- VectorVest, Inc.
- Executive Premier Workshop
- One-Day Options Course
- OptionsPro
- Retirement Income Workshop
- Sure-Fire Trading Systems (VectorVest, Inc.)
- Trading as a Business Workshop
- VectorVest 7 EOD
- VectorVest 7 RealTime/IntraDay
- VectorVest AutoTester
- VectorVest Educational Services
- VectorVest OnLine
- VectorVest Options Analyzer
- VectorVest ProGraphics v6.0
- VectorVest ProTrader 7
- VectorVest RealTime Derby Tool
- VectorVest Simulator
- VectorVest Variator
- VectorVest Watchdog
