HOT TOPICS LIST
- MACD
- Fibonacci
- RSI
- Gann
- ADXR
- Stochastics
- Volume
- Triangles
- Futures
- Cycles
- Volatility
- ZIGZAG
- MESA
- Retracement
- Aroon
INDICATORS LIST
LIST OF TOPICS
PRINT THIS ARTICLE
by Paolo Pezzutti
The force index combines price and volume to provide you with the strength of bulls and bears both.
Position: N/A
Paolo Pezzutti
Author of the book "Trading the US Markets - A Comprehensive Guide to US Markets for International Traders and Investors" - Harriman House (July 2008)
PRINT THIS ARTICLE
TECHNICAL ANALYSIS
Alexander Elder: The Force Index
09/12/05 02:44:27 PMby Paolo Pezzutti
The force index combines price and volume to provide you with the strength of bulls and bears both.
Position: N/A
| Alexander Elder, in his well-regarded book Trading For A Living, introduced the force index. It is an oscillator that attempts to measure the force of bulls during uptrends and the force of bears in downtrends. It takes into account price and volume. In this way, the force of every move is defined by its direction, distance, and volume. The underlying concept is simple: - A positive close of prices will print a positive force, and a negative close of prices will print a negative force - The greater the volume, the greater the force, and - The greater the price change, the greater the force. The rule for its construction is: Force Index = Volume * (close-close of the previous day) Below is the TradeStation implementation of the indicator: inputs: Length1(2),Length2(13),Force_I(Volume * (Close - Close[1])); Plot1(XAverage(Force_I,Length1),"Force1"); Plot2(xAverage(Force_I,Length2),"Force2"); As you can see, the short-term force index is normally smoothed with a two-day exponential moving average (EMA) to help find entry points into the market. Smoothing is done because the raw indicator appears very jagged. In his book, Elder suggests that it pays to buy when the two-day EMA of the indicator is negative and sell when it is positive. A 13-day EMA of the force index helps to track longer-term changes in the force of market's participants. When it is positive, it means that bulls are in control. When it becomes negative, it means the bears have taken control. As with any oscillator, divergences could help identify turning points. |
| The concept behind this indicator is that a big price change testifies the importance of the victory. At the same time, the volume provides you with the information related to the market commitment of the public to the move. In the author analysis, high-volume rallies and declines have more inertia and are likely to continue. Low volume indicates that the supply of new participants is low and the trend is near an end. The two-day EMA of the force index is used to pinpoint buying and selling opportunities. When a trend-following indicator identifies an uptrend, you will spot an entry point when the two-day EMA of the force index is negative, placing a buy order above the high of that day. The opposite is true during downtrends. If you are a short-term trader, you will exit your long trade--for example, when the two-day exponential moving average of the force index turns positive. As an alternative, you may want to add to your positions whenever the indicator gives signals in the direction of the trend. The 13-day exponential moving average of the force index is used to identify longer-term changes in the strength of market participants. Above the centerline, the trend is positive; below it, bears are in control. A new peak indicates that a rally is likely to continue. Divergences can also give very good indications of turning points. Spikes of the indicator suggest that, in the long run, markets have reached a top or a bottom. |

|
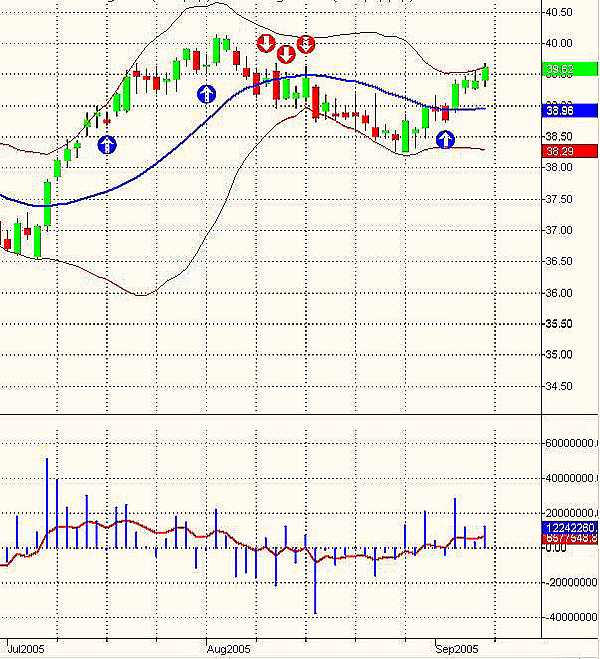
| FIGURE 1: THE QQQQ DAILY CHART AND THE FORCE INDEX INDICATOR. The indicator helps find entry points after pullbacks during a trend. |
| Graphic provided by: TradeStation. |
| |
| In Figure 1, you can see how, in the past two months, this simple indicator managed to spot short-term entry points on the daily QQQQ time frame. During the July uptrend, there were two entries, while during the August correction, it signalled three short trades. The newborn trend, so far, has had only one pullback, which was used to enter the market. Note that, at the end of the July uptrend and the August correction, the indicator printed significant divergences. Of course, in order to implement a successful trading system, you also have to define your money management and risk management rules. In his book, Alexander Elder presents a triple screen trading system developed back in 1985, which combines trend-following methods and countertrend techniques. |
Author of the book "Trading the US Markets - A Comprehensive Guide to US Markets for International Traders and Investors" - Harriman House (July 2008)
| Address: | VIA ROBERTO AGO 26 POSTAL CODE 00166 |
| Rome, ITALY | |
| Phone # for sales: | +393357540708 |
| E-mail address: | pezzutti.paolo@tiscali.it |
Click here for more information about our publications!
Comments
Date: 09/12/05Rank: 4Comment:
Date: 09/13/05Rank: 5Comment:
Date: 09/13/05Rank: 4Comment:
Date: 09/13/05Rank: 4Comment:
Date: 11/14/06Rank: 1Comment:
Date: 09/26/17Rank: 5Comment:

Request Information From Our Sponsors
- StockCharts.com, Inc.
- Candle Patterns
- Candlestick Charting Explained
- Intermarket Technical Analysis
- John Murphy on Chart Analysis
- John Murphy's Chart Pattern Recognition
- John Murphy's Market Message
- MurphyExplainsMarketAnalysis-Intermarket Analysis
- MurphyExplainsMarketAnalysis-Visual Analysis
- StockCharts.com
- Technical Analysis of the Financial Markets
- The Visual Investor
- VectorVest, Inc.
- Executive Premier Workshop
- One-Day Options Course
- OptionsPro
- Retirement Income Workshop
- Sure-Fire Trading Systems (VectorVest, Inc.)
- Trading as a Business Workshop
- VectorVest 7 EOD
- VectorVest 7 RealTime/IntraDay
- VectorVest AutoTester
- VectorVest Educational Services
- VectorVest OnLine
- VectorVest Options Analyzer
- VectorVest ProGraphics v6.0
- VectorVest ProTrader 7
- VectorVest RealTime Derby Tool
- VectorVest Simulator
- VectorVest Variator
- VectorVest Watchdog
