HOT TOPICS LIST
- MACD
- Fibonacci
- RSI
- Gann
- ADXR
- Stochastics
- Volume
- Triangles
- Futures
- Cycles
- Volatility
- ZIGZAG
- MESA
- Retracement
- Aroon
INDICATORS LIST
LIST OF TOPICS
PRINT THIS ARTICLE
by Paolo Pezzutti
Katrina's potential impact on the economy could affect investors' attitude.
Position: N/A
Paolo Pezzutti
Author of the book "Trading the US Markets - A Comprehensive Guide to US Markets for International Traders and Investors" - Harriman House (July 2008)
PRINT THIS ARTICLE
CURRENCY TRADING
Forex EUR/USD: What's Next For The Dollar?
09/12/05 08:37:42 AMby Paolo Pezzutti
Katrina's potential impact on the economy could affect investors' attitude.
Position: N/A
| At the beginning of September, the dollar slumped to the lowest level seen since May amid the ever-widening evidence of the destructive effects of Hurricane Katrina. Currency markets focused closely on how Katrina would affect the US's refining capacity. Some analysts believe that the increase in gasoline prices could slash the US fourth-quarter Gross Domestic Product (GDP) growth by 1.5%. This view is influencing the expectations for higher US interest rates, which contributed to sustain the dollar this year. Some speculate that the Federal Reserve will end the run of 10 straight interest rate increases. Moreover, business and consumer interests were pressed even before the arrival of Katrina, with weak manufacturing data and GDP growth and inflation estimates both revised downward. Only nonfarm payrolls data met forecasts, giving the dollar some relief. At the same time, the European Central Bank (ECB) held its main refinancing rate at 2% for the 27th straight month. The decision was expected, with modest signs of economic recovery in the 12-nation bloc to risk choking off domestic demand by raising rates. The recent surge in oil prices in the wake of Katrina could push inflation higher in future months, but with a likely slowdown of global economic growth, few see the ECB raising rates early. |

|
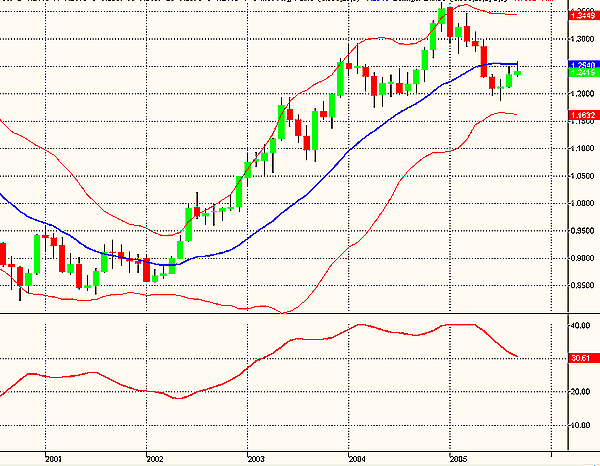
| FIGURE 1: THE EUR/USD MONTHLY CHART |
| Graphic provided by: TradeStation. |
| |
| What do we have to look forward to, with such factors influencing currencies in opposite directions? Which will prevail on the fundamentals side? How can we predict currency flows? Let's see whether we can get some answers from technical analysis. On the technical side, I will use the Bollinger Bands and the average directional movement index (ADX) to assess the EUR/USD market condition. Bollinger Bands use a 20-day simple moving average, plotting the bands two standard deviations above and below the average. They help finding turning points and are an excellent indicator of relative overbought and oversold conditions. The ADX measures the trend quality of a security, independent of direction. The greater the ADX value, the stronger a security is trending. Traditionally, values above 30 are assumed to indicate an ongoing trend. In Figure 1, you can see the EUR/USD monthly chart. Prices started an uptrend in 2002, moving from the 0.85 level to a high of about 1.36 at the end of 2004. Since then, prices gave way to a correction that brought prices to a relative low of about 1.19 in July. During this phase, the ADX moved from the 40 level to 30 and is still decreasing. The Bollinger Bands are parallel and flat. This time frame indicates that a trading range type of action is ongoing. There is no evidence of a directional impulse. |

|
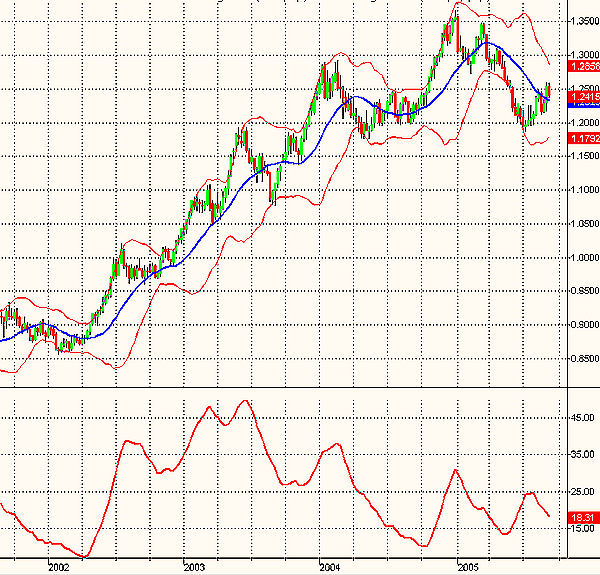
| FIGURE 2: THE EUR/USD WEEKLY CHART |
| Graphic provided by: TradeStation. |
| |
| The weekly chart (Figure 2) displays the uptrend started in 2002 and the following corrective action. Note that the ADX during the uptrend did not provide confirmation to the relative highs at the beginning and the end of 2004, printing two significant divergences. The downward move, from last January to the beginning of July, did not manage to print an ADX value above 25. Not enough, for assessing the EURUSD long-term uptrend is over. Since then, the ADX went down to 19, with prices going up to about 1.25--not enough to say another leg of the uptrend has started. What next? Prices pulled back to the moving average, with Bollinger Bands converging. In this time frame, a trading range environment is the most likely market condition in the next weeks. |

|
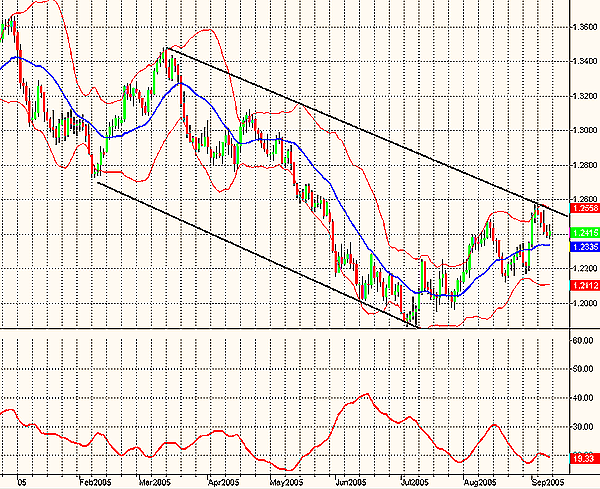
| FIGURE 3: THE EUR/USD DAILY CHART. Prices are moving within a negatively inclined channel. |
| Graphic provided by: TradeStation. |
| |
| In Figure 3, you can see the daily chart. Note that the ADX printed two significant divergences when prices reached the high at the end of 2004 and the low in July 2005. The first leg up since July saw the ADX still going down; the second leg up in August brought ADX up to 25. The third leg, still ongoing, is printing an ADX level of 19 (still low), but opening bands and wide-ranging bars to the upside. During the last trading sessions, Hurricane Katrina's potential effects have significantly influenced investors. The technical conditions have changed, at least in the short term. Investors are now looking at a weaker dollar, until the impact of Katrina on the economy is clearer. Prices, however, could run into an important resistance (1.27-1.28 level), testing the market determination for higher prices and another leg of the euro's long-term uptrend. |

|
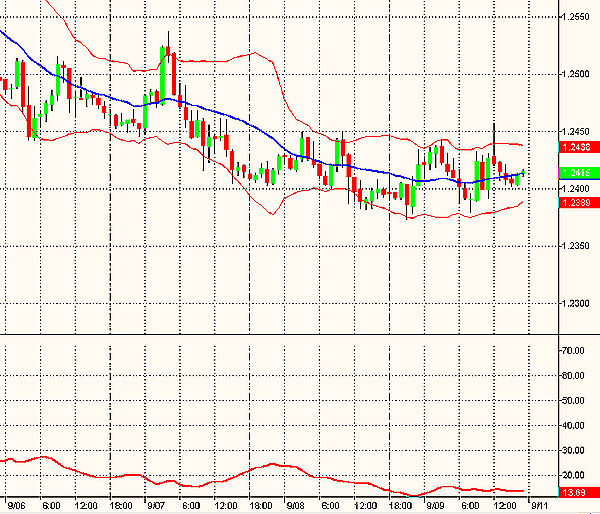
| FIGURE 4: THE EUR/USD 60-MINUTE CHART. In this time frame, there is low volatility and low directionality. |
| Graphic provided by: TradeStation. |
| |
| In Figure 4, you can see the 60-minute chart. The trading range of the last sessions has brought the ADX to extremely low values. This is a good indication that volatility will come soon in this frame, for those who want to switch a breakout mode in the very short term. |
Author of the book "Trading the US Markets - A Comprehensive Guide to US Markets for International Traders and Investors" - Harriman House (July 2008)
| Address: | VIA ROBERTO AGO 26 POSTAL CODE 00166 |
| Rome, ITALY | |
| Phone # for sales: | +393357540708 |
| E-mail address: | pezzutti.paolo@tiscali.it |
Click here for more information about our publications!
Comments
Date: 09/13/05Rank: 4Comment:
Date: 09/13/05Rank: 4Comment:
Date: 01/14/06Rank: 5Comment:

Request Information From Our Sponsors
- StockCharts.com, Inc.
- Candle Patterns
- Candlestick Charting Explained
- Intermarket Technical Analysis
- John Murphy on Chart Analysis
- John Murphy's Chart Pattern Recognition
- John Murphy's Market Message
- MurphyExplainsMarketAnalysis-Intermarket Analysis
- MurphyExplainsMarketAnalysis-Visual Analysis
- StockCharts.com
- Technical Analysis of the Financial Markets
- The Visual Investor
- VectorVest, Inc.
- Executive Premier Workshop
- One-Day Options Course
- OptionsPro
- Retirement Income Workshop
- Sure-Fire Trading Systems (VectorVest, Inc.)
- Trading as a Business Workshop
- VectorVest 7 EOD
- VectorVest 7 RealTime/IntraDay
- VectorVest AutoTester
- VectorVest Educational Services
- VectorVest OnLine
- VectorVest Options Analyzer
- VectorVest ProGraphics v6.0
- VectorVest ProTrader 7
- VectorVest RealTime Derby Tool
- VectorVest Simulator
- VectorVest Variator
- VectorVest Watchdog
