HOT TOPICS LIST
- MACD
- Fibonacci
- RSI
- Gann
- ADXR
- Stochastics
- Volume
- Triangles
- Futures
- Cycles
- Volatility
- ZIGZAG
- MESA
- Retracement
- Aroon
INDICATORS LIST
LIST OF TOPICS
PRINT THIS ARTICLE
by David Penn
Wave 1 ended with August. Is wave 2 already all but complete?
Position: N/A
David Penn
Technical Writer for Technical Analysis of STOCKS & COMMODITIES magazine, Working-Money.com, and Traders.com Advantage.
PRINT THIS ARTICLE
ELLIOTT WAVE
Elliott Wave Update
09/09/05 02:57:37 PMby David Penn
Wave 1 ended with August. Is wave 2 already all but complete?
Position: N/A
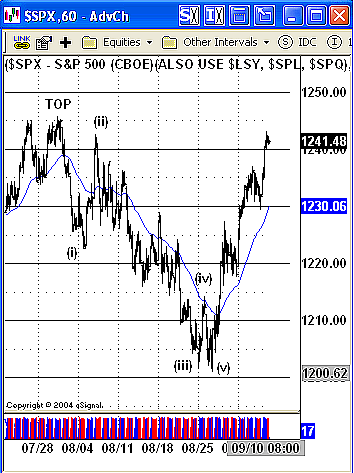
| My last Elliott wave offering suggested that the first five waves down of the next cyclical bear market began in August ("The First Five Down?" August 19, 2005). Taking the price action over the past six weeks in sum, it appears as if a more significant "first five down" has been completed as of the end of August. This set of five waves appears to have fallen somewhat short of the targets I anticipated--which might partly explain the strength of the "bounce" that began on August 31. |
| Nevertheless, as long as the August highs hold, there is a reasonable chance that the market has already begun what will be a dizzying descent back into bear market hell circa 2002--or worse. See Figure 1. First, let's take a look at the market in August, which I believe has completed a wave 1 down. |

|
| FIGURE 1: The five waves down in August 2005 ended with a significant trading low late in the month. |
| Graphic provided by: eSignal. |
| |
| As I wrote for Traders.com Advantage ("Portrait Of A Short Squeeze," September 9, 2005), there were a number of clues that the low in latest August was a significant one. These clues include social mood (the Cindy Sheehan/Katrina combo), sentiment (put/call ratio extremes), cycles (the September issue of Tim Wood's Cycles News And Views is especially enlightening in this regard), as well as running positive divergences in both the moving average convergence/divergence histogram (MACDH) and stochastic. The trick was in figuring out how significant of a low. The abundance of "bottoming" clues mentioned should have played a larger role in my thinking. As it was, I had convinced myself that rather than a completed wave 5, the market had only completed three waves--with the bounce in late August being merely an advance in a fourth-wave correction. But this idea was demolished when the $SPX rallied above the low of wave (i) on September 1. One golden rule of Elliott wave analysis is that a wave 4 cannot enter the price territory of a wave 1 (unless the market is in a triangle). Thus, as soon as the market reentered the territory of wave (i), I was forced to reconsider my previous count. |
| Where does that leave the market now? Since bottoming in late August, the market has rallied sharply in a V-shaped move that bears all the earmarks of "wave 2" short-covering (again, see my "Portrait Of A Short Squeeze" in Traders.com Advantage). Of critical importance will be the Standard & Poor's 500's ability to close above the August highs. Such a close would negate the wave count presented here and, if the Dow Jones industrials and transports follow suit, could also mean that a significant advance into the rest of September was in the cards. |
| By the way, I recently wrote about this development in a Traders.com Advantage article, "Transports Find Support At Old Breakout," September 8, 2005. Since that article was published, the Dow transports slipped below that support level. In fact, on Friday, September 9, the transports fell--on a percentage basis--as much as the industrials rallied. If this pattern continues--rising industrials and falling transports--then there is the possibility of a nonconfirmation that would bode well for the bearish case for stocks. On the other hand, a breach of the August highs by both the industrials and the transports would create the potential for the sort of "significant advance" mentioned. |
Technical Writer for Technical Analysis of STOCKS & COMMODITIES magazine, Working-Money.com, and Traders.com Advantage.
| Title: | Technical Writer |
| Company: | Technical Analysis, Inc. |
| Address: | 4757 California Avenue SW |
| Seattle, WA 98116 | |
| Phone # for sales: | 206 938 0570 |
| Fax: | 206 938 1307 |
| Website: | www.Traders.com |
| E-mail address: | DPenn@traders.com |
Traders' Resource Links | |
| Charting the Stock Market: The Wyckoff Method -- Books | |
| Working-Money.com -- Online Trading Services | |
| Traders.com Advantage -- Online Trading Services | |
| Technical Analysis of Stocks & Commodities -- Publications and Newsletters | |
| Working Money, at Working-Money.com -- Publications and Newsletters | |
| Traders.com Advantage -- Publications and Newsletters | |
| Professional Traders Starter Kit -- Software | |
Click here for more information about our publications!
Comments
Date: 09/09/05Rank: 3Comment:
Date: 09/09/05Rank: 5Comment:
Date: 09/25/05Rank: 5Comment:

Request Information From Our Sponsors
- StockCharts.com, Inc.
- Candle Patterns
- Candlestick Charting Explained
- Intermarket Technical Analysis
- John Murphy on Chart Analysis
- John Murphy's Chart Pattern Recognition
- John Murphy's Market Message
- MurphyExplainsMarketAnalysis-Intermarket Analysis
- MurphyExplainsMarketAnalysis-Visual Analysis
- StockCharts.com
- Technical Analysis of the Financial Markets
- The Visual Investor
- VectorVest, Inc.
- Executive Premier Workshop
- One-Day Options Course
- OptionsPro
- Retirement Income Workshop
- Sure-Fire Trading Systems (VectorVest, Inc.)
- Trading as a Business Workshop
- VectorVest 7 EOD
- VectorVest 7 RealTime/IntraDay
- VectorVest AutoTester
- VectorVest Educational Services
- VectorVest OnLine
- VectorVest Options Analyzer
- VectorVest ProGraphics v6.0
- VectorVest ProTrader 7
- VectorVest RealTime Derby Tool
- VectorVest Simulator
- VectorVest Variator
- VectorVest Watchdog
